Sampling Considerations - Because virtually every measurement of nature shows variation, scientists have developed procedures for sampling and replication to gain confidence that their data represent reliable estimates or important differences. Generally, more sampling increases the ability to detect significant differences. It is possible to detect differences that are so small that they are not important. However, with budget constraints for land management and monitoring, the more common problem is collecting enough data to gain confidence that the samples represent reality rather than simply random variation. Further adequate sample size is necessary to ensure that real and important change is not hidden by random variation.
In monitoring, there is always a tradeoff between the efficiency of taking multiple samples at one location and the increased information from collecting samples from many different locations. For example, collecting data from one plot at each of a dozen different locations would tell more than the same amount of information from a dozen different plots at one location. If all the data are from one location, the question remains, "How representative was this location?"
"How many plots and how many locations?" is an age-old question, and the answer depends on data variation (more variation leads to more samples), how precisely you need to know (it requires more data to detect smaller differences), how expensive the data are to collect, and how important it is to know. It also depends on the resource objective(s). When setting objectives, managers should consider the cost of monitoring. There is an ideal match among the size of the change, the variability and expense of detecting the change, and the importance of the change. To justify an objective that targets a small change in a variable parameter, it must be very important because it will require a great many samples or replicate study sites to measure with enough precision to detect the change (or not) with confidence. Conversely, a change that is very obvious may be recorded with only a photograph, and may be easy to justify based on the low cost of monitoring. More information on statistical and sampling considerations is in Appendix I - Statistical Considerations.
To avoid having to sample an excessive number of locations, monitoring often reduces the variability by focusing on key areas where change across time should reflect the response from planned management action. That is, they focus on areas that are getting the prescribed treatment and where the objectives would show a change if the management works. Monitoring sites are not located in areas that do not have and represent management concerns, nor in areas where management actions are expected to not affect conditions. Key areas are discussed in the following section and in Appendix H - Procedures for Selecting Key Areas and Key Species. Key areas have thus been used to replace multiple random sampling locations. Monitoring random locations without using key areas selected by managers to be representative of important objectives requires many sampling locations within the unit (e.g. allotment) sampled.
Key Areas - Proper selection of key area(s) is an essential step in a representative monitoring program. A key area is a relatively small portion of a unit selected as a point for monitoring change in vegetation or soil and the impacts of management. It is chosen because of its location, use, sensitivity to management and value. It is assumed that key areas, if properly located, will reflect the current management over similar important areas in the unit. Key areas should represent range conditions, trends, seasonal degrees of use, and resource production and values. Key areas may be selected to represent a particular plant community phase, a specific ecological site or disturbance response group, or some other significant portion of a management unit.
Key areas in a unit may change if management, plant communities and/or objectives change. Therefore, key areas should be periodically re-evaluated to assure that the overall monitoring results reflect the situation in the unit and current objectives. However, the value of long-term data sets should be considered as well, prior to abandonment of past key areas.
Critical Areas - Where needed, an area may be selected for monitoring where a special management concern warrants additional attention. This kind of area is termed a critical management area or critical area. Critical areas often represent smaller parts of management units that are more important to managers, such as riparian areas or specific places in riparian areas where there is a need to focus management and monitoring. Designated monitoring areas (Burton et al. 2011) are similar. (See Appendix H - Procedures for Selecting Key Areas and Key Species)
Key Species - Key species are the forage species whose use serves as an indicator to the degree of use of associated species, or those species which must, because of their importance, be considered in the management program (Bedell 1998). More than one key species may be selected, depending on objectives and data needs. Allotment objectives are often based on improving or maintaining the amount or distribution of key species. Plants may be selected for monitoring wildlife habitat, watershed or other attributes if they tie land management to ecosystem processes targeted by objectives.
Observation of key forage species can indicate the general degree of grazing use on a key area and may indicate grazing use of closely related species. Species with low palatability should not be selected for forage utilization studies since they may give a false lower use rating, leading to higher use on the more palatable forage species. Similarly, plants that are highly palatable "ice-cream" species with low composition in the forage base (<15%) make inappropriate key species. (See Appendix H - Procedures for Selecting Key Areas and Key Species)
Short-Term Monitoring
Short term, or implementation, monitoring addresses four topics:
- conformance with management plans (the actions applied – e.g. actual use dates by pasture or use area),
- current, annual or short-term impacts of the implemented management on resources of interest,
- weather and
- other unplanned events (e.g. fire).
This information guides day-to-day and year-to-year management by monitoring within-season triggers and end-point indicators. Accumulated short-term monitoring records help interpret trend and other long-term monitoring information. These data will provide a logical and reasonable basis for continuing or adjusting current management practices.
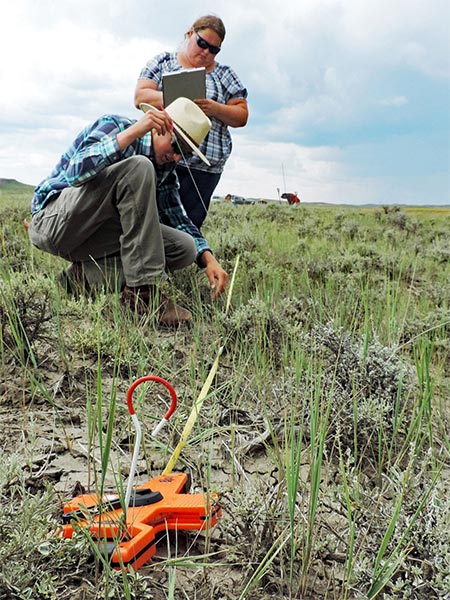 Figure 13. Measuring progress toward objectives in carefully selected key areas enables data to be used strategically for adapting management.
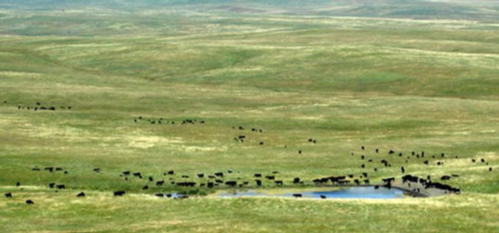 Figure 14. Because cattle are central place foragers, key areas are often placed after consideration of use patterns across the landscape.
For livestock grazing management, short-term monitoring may include gathering data and keeping records of observations on actual use (See form for this in Perryman et al. 2006), distribution patterns and utilization (Appendix J — Use Mapping, Key Species Method, and Proper Use), streambank alteration (Burton et al. 2011), growing conditions, wildlife use, insect infestations, fire and adequacy of range improvements. Short-term monitoring may also include notes recorded in a pocket calendar or herd book (red book) and other livestock management records, precipitation and temperature measurements, use pattern mapping, residual vegetation studies, and photography.
Often short-term monitoring leads to management decisions within the grazing season. Plant phenology may provide evidence that a planned turn-out or removal date is too early or too late. Within-season triggers could include changes in livestock behavior, such as a shift in use areas or preferred forage species or reaching planned seasonal utilization on specific plants or plant groups. Weather events may also indicate the time to move in order to provide opportunity for regrowth. Monitoring end-of-season indicators (at the end of the growing and grazing season) could include percent of browsed shrub leaders, stubble height and/or utilization. This documents the accumulated influence or lack of influence of current year’s management and establishes the amount of regrowth to assist in planning future management. Management changes that are based on multiple years of monitoring are usually more reliable than changes based on just one or two because of variability in environmental conditions and associated use patterns. Furthermore, strict adherence to triggers can cause sudden changes throughout a management system (Smith et al. 2005).
Before making an adjustment in the timing, duration, and intensity of grazing, utilization and other short-term monitoring data from several years prior must be considered. However, if the use of triggers is the management strategy, then animal movements may be based on annual use levels. Prompt implementation of management changes may keep rangeland more productive. The need for triggers and the strictness of their application should vary on a case-by-case basis, depending on the current status of the resource in relation to the objectives and the degree to which an action prohibits or enables achieving those objectives. For example, movement at a utilization trigger is usually not important in the dormant season, or if the principle strategy is short duration grazing with recovery.
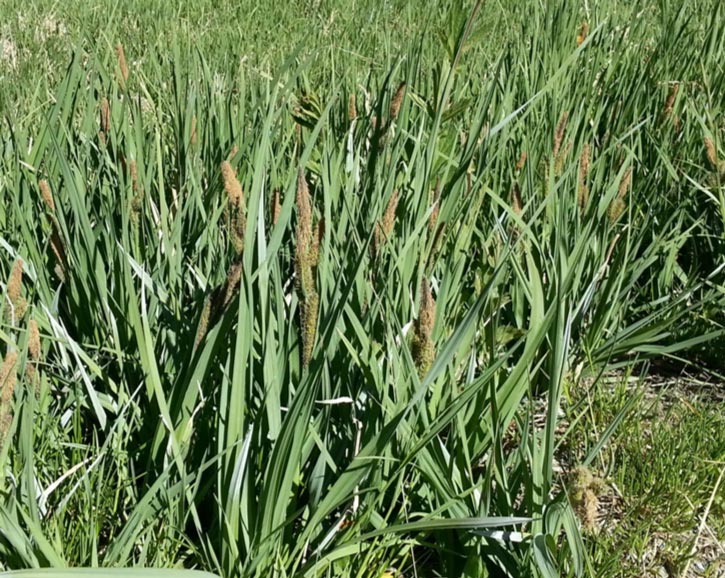 Figure 16. Nebraska sedge or other stabilizing riparian species are considered key species in many riparian areas.
Long-Term Monitoring
Long-term, or effectiveness, monitoring measures changes over time in resource attributes. It periodically measures progress toward meeting long-term objectives. It also helps determine the applicability and effectiveness of annual indicators or triggers. Long-term monitoring usually occurs at permanent sampling locations. Techniques used or types of data collected periodically for long-term monitoring may include frequency; percent composition by weight of the vegetation; (See Production and Plant Community Objectives side bar.), resource value ratings; remote sensing, including ground and aerial photography (Appendix G — Remote Sensing to Monitor Rangelands); and photo plots (Perryman et al. 2006)).
Because objectives vary by location, long-term monitoring methods must also vary (BLM 1999a; Herrick et al. 2005a and b; Elzinga et al. 1998). However, because long-term monitoring is intended to detect trend, it is very important that methods be used consistently over time at specified locations. Locations should be periodically re-evaluated to ensure they continue to provide information that is useful for management.
Vegetation attributes are monitored most often because vegetation is an integral part of most ecological processes and responds directly to management. Measurements of species composition by weight were the gold standard for determining range condition (Dyksterhuis 1949). Quadrat frequency data have been collected on many BLM lands since the early 1980s (Nevada Range Studies Task Group 1984). Vegetation cover and line-point intercept were selected for the BLM Assessment Inventory and Monitoring method (Toevs et al. 2011). However, cover techniques are not all equivalent, e.g. foliar versus canopy (BLM 1999a), and caution is needed for comparisons of cover data. Recently, dynamic soil properties (Herrick et al. 2005a and b) and multiple indicator riparian monitoring (MIM) (Burton et al. 2011) are receiving increased attention. Use of the appropriate monitoring method is vital to assessment of the effectiveness of management.
Traditionally, vegetation monitoring methods were designed with the idea that vegetation changes at the monitoring site (key area) should reflect progress toward or away from objectives. MIM uses a designated monitoring area that is selected to randomly sample a reach of interest (Prichart et al. 1998; Dickard et al. 2015).
References describe the methods for many accepted monitoring techniques. With developing technologies, tools are increasingly available to electronically capture and store field data. The use of these tools should not preclude the use of paper data forms when needed or preferred.
Some objectives refer to spatial problems like the expansion of trees onto adjacent rangeland ecological sites or the invasion of weeds, and it may be more useful to measure these changes across broad areas. If such changes are clearly visible, landscape oblique or aerial photographs capture the relevant information very well. Less visible changes may require the use of large-scale maps or transects across edges of community types.
Probably the most used long-term monitoring method is repeat photography. In the absence of quantitative data, or in the presence of conflicting or confusing quantitative data, many people rely on what is observable in photographs. Photography can be fast and, with proper labeling and storage, provides a record that can be used in many different ways. Furthermore, photographs may address issues that were not important when earlier pictures were taken (e.g. photos in Gruell and Swanson 2012). Not all photographic media however, is equally durable. Backup copies and their durability should be considered for photo archives.
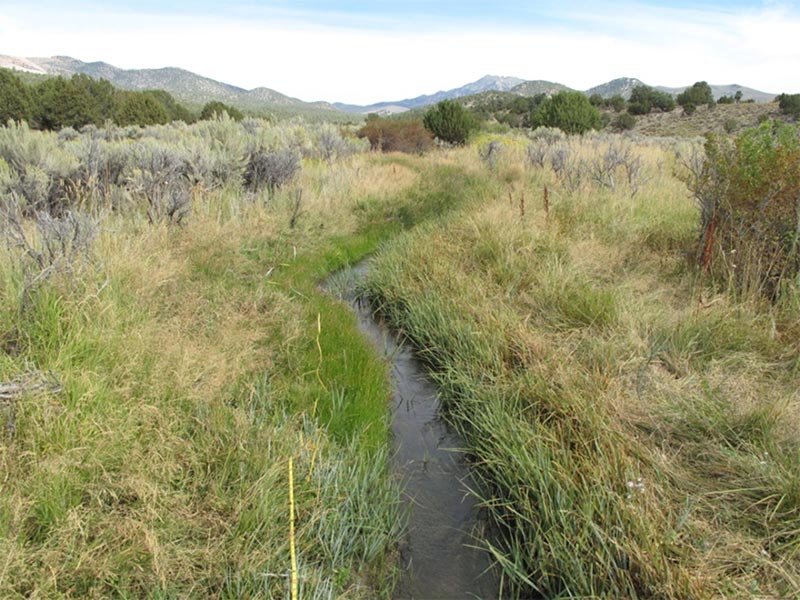 Figure 17. Where changes to streambank stability or channel pattern focus riparian objectives, the Greenline is a logical place to measure progress.
Roles and Responsibilities
Ideally, monitoring would occur across ownership boundaries in pursuit of the agreed upon goals and objectives of a coordinated management plan. In reality, landowners (including owners of land leased to others for grazing livestock) and land management agencies have responsibility for both the care of the land and its monitoring. Land management agencies have a legal requirement to monitor land use activities for multiple purposes. Producers depend on monitoring information to adjust management that impacts resource productivity and may influence future opportunities to graze. All parties should review the information together on an annual basis and use it to plan management adjustments or affirm strategies for the following grazing season. Land users other than livestock producers may also take an active part in monitoring their own use(s) and the achievement of objectives in which they are a stakeholder.
Grazing management aims in part to maintain the quality and quantity of forage needed for a successful livestock operation. Agencies and their managers seek to balance many competing and complementary interests expressed in policy, law, regulation and plans. The ideal relationship between the producer and the land management agencies results in the identification of monitoring tools and management practices that meet the needs of each. The idea of cooperative monitoring is embraced by the Public Lands Council in memoranda with the BLM and FS. Because agencies have requirements about data quality for rangeland monitoring, it is important for producers to use accepted methods. The more a producer participates in or initiates cooperative monitoring, the more influence they may have in improving management. Furthermore, cooperative permittee monitoring may encourage agencies to become more effective as partners in monitoring and management. A template for a cooperative monitoring agreement is in Appendix A— Cooperative Monitoring.
Weather is an important environmental attribute and a key element of a rangeland monitoring program. Producers should track such things as weather, growing conditions, the results of management, etc., to help make appropriate grazing management decisions (See Appendix C — Weather Variability.) The Ranchers’ Monitoring Guide (Perryman et al. 2006) provides additional information and forms for collecting and recording weather information.
Management agencies have regulatory responsibilities for short- and long-term monitoring to ensure that permitted or leased activities are conducted to meet goals, objectives and standards. To provide guidance for this, the BLM has the 4180 Handbook, Rangeland Health Standards (BLM 2005) and a technical reference, Rangeland Monitoring, Analysis, Interpretation, and Evaluation (BLM 1984), and the FS has 2209.21 Rangeland Ecosystem Analysis and Monitoring Handbook. The agencies are responsible for coordinating and cooperating with producers in all phases of monitoring. Agencies encourage active producer participation especially in short-term monitoring. Furthermore, good things happen when ranchers and agencies monitor and adapt their management when needed.
 Figure 18. Within the monitoring framework, all parties should review the information together to adapt management.
Production and Plant Community Objectives
Ecological sites (Appendix B — Ecological sites) are production-based. For an indication of the degree of similarity and feasibility or achievability of an objective for a key area, compare existing species composition to the ecological site description. The procedure can vary depending on the issues and objectives for the area being monitored. Required data can range from directly estimating the species composition by weight to conducting a 10-30 plot weight estimate transect. The dry weight rank, comparative yield or weight-estimate-transect method for determining the species composition of an ecological site would be employed in areas where the issues and objectives dictate the need for production type data. The double weight sampling technique (BLM 1999a; Elzinga et al. 1998; Herrick et al. 2005b) is a suitable technique if followed correctly.
Where a quantitative ecological comparison to a reference plant community or Desired Plant Community (DPC) is warranted, the species present and their percent composition by weight are compared to the reference plant community or DPC.
When selecting and using a particular technique, it is necessary to:
- Document the method used so it can be repeated at a later date.
- Confine the weight estimate transects within the boundaries of an ecological site and key area.
- Document the transect location on an aerial photo, map, GPS and/or by narrative. (See the Study Site Location form in Appendix H — Procedures for Selecting Key Areas and Key Species.)
