Phenology
Plant phenology is the study of the plant’s life cycle (e.g., leaf emergence, flowering, seed ripening, etc.) in relation to seasonal weather factors. Because the time of occurrence of phenological events is controlled to a large degree by precipitation (seasonal distribution and event size and frequency) and temperature, plants can be used as indicators of differences in growing conditions. Phenological data are helpful for understanding monitoring observations and measurements. Observations of the growth stage(s) when forage species are defoliated (especially critical growth stages such as the boot stage and flowering of grasses) can help explain or predict the response of the key and non-key species in a management unit. Plants respond to grazing quite differently when defoliated at different growth stages.
Fire-Related Monitoring
When fire occurs on rangelands, management should be adjusted accordingly. Monitoring programs should recognize this influence and document where, when and the effects of fire for planning and implementing needed changes. Information on prefire conditions, such as fuel load, species composition and transitions to other states (Appendix B – Ecological Sites)) is often critical for making treatment and management decisions. Such information may be available from permanent transects, aerial photos, soil surveys, ecological site descriptions, etc.
Postfire monitoring includes fire effects, treatments and follow-up management. Burned areas, especially small ones, often attract use by wildlife, wild horses and burros, and/or livestock. Mapping this use can help explain patterns of recovery or lack thereof. One of the most important burned area observations to record/map is the location of unburned islands and/or the survival of herbaceous perennials and important shrubs. Postfire rehabilitation and stabilization treatments should be well documented, including actual location, seed mixes, effective seeding rate, methods used, weather and other data/information that may help explain a postfire management actions success or failure. Postfire monitoring measures vegetation response and movement toward desired plant communities. Adaptive management is crucial to achieve desired results.
Exclosures and Comparison Areas
Exclosures are customarily used for visual observation and studies to compare vegetation change under adjacent grazed and ungrazed conditions. Exclosures protect the plant community from livestock (and sometimes wildlife) grazing but permit exposure to other processes (drought, wildfire, insects, some herbivory, etc.) experienced by the grazed area. These are very different from utilization cages that must be moved to accurately represent un-grazed current year’s plant growth in the embedded grazed plant community. Exclosures and comparison areas are each placed in a fixed location.
Comparison areas are used, along with other methods, to determine the composition and production that a particular ecological site is capable of producing with different historical management. They are helpful as a gauge or comparison for measurement when considering objectives or monitoring species composition and trend. The history and location of these areas should be documented. Examples of comparison areas may include areas protected from domestic livestock grazing because of inaccessibility or lack of water; sites with high ecological status, resilience, and resistance to transitioning across a threshold; and large exclosures, old cemeteries, or other areas that have been protected from livestock grazing for several years or decades. (These areas can give useful information, but they can also be misleading because of the effects of local micro-environment, weather conditions, past disturbances, vegetation stagnation, or altered fire regime or fire effects (Davies et al. 2016).
Grazing Response Index (GRI)
This tool combines several components of a grazing strategy, frequency of defoliation, intensity of use (utilization), and opportunity for growth or regrowth. The grazing response index in the Ranchers’ Monitoring Guide (Reed et al. 1999; Perryman et al. 2006 and 2017; Wyman et al. 2006) may be very useful as a planning tool or to help interpret multiple data sources such as actual use records, notes about phenological stage or the time of the growing season when grazing and regrowth occurred, and utilization or residual vegetation data.
It must be stressed that the grazing response index is most applicable and useful to both livestock and land managers as a planning tool, providing valuable information for adaptive management. GRI is not, and should not be, used as an objective or a standard. It may provide confidence that grazing within an existing permit is providing the management needed to enable plant growth and riparian or upland range recovery or health.
The grazing response index could easily be augmented with an additional planning tool considering variation in use period between or among years (Swanson et al. 2015). An area grazed in a different season from last year could be rated +1. Use in the same period could be rated -1, and use in a similar season but different phenology stage could be rated as 0 or neutral in affect. Also, some other index could be developed to evaluate the application of important strategies for management to encourage plant growth or to reach objectives.
Grasing Response Index (GRI)
Frequency, Intensity and Opportunity
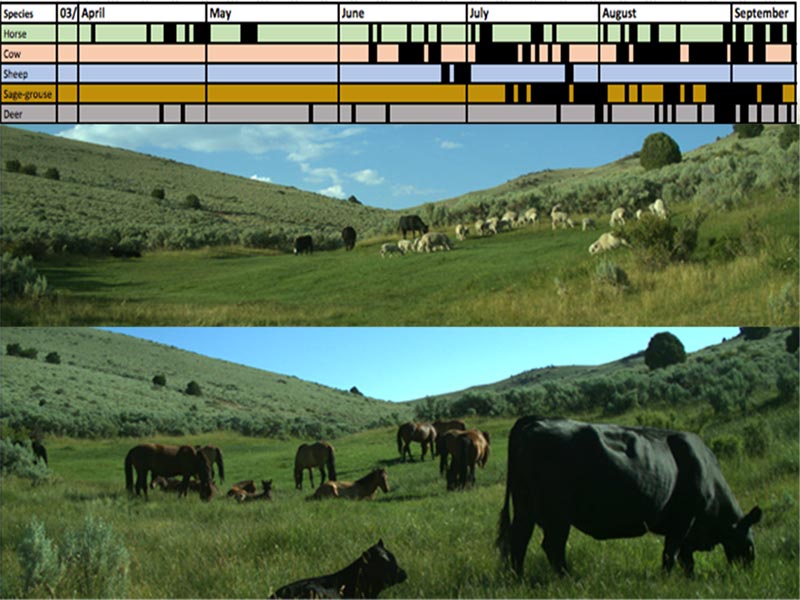 Figure 36. Riparian meadows attract many species of ungulates, and finding a way to sort out use by different grazers is important for identifying management needs and tracking management strategies.
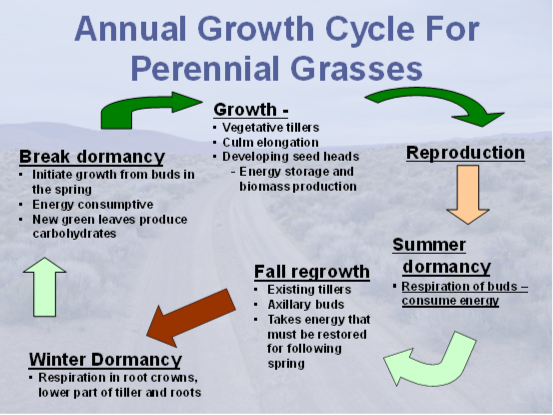 Figure 37. Each phenological stage of plant growth has different physiological needs that must be met to ensure the plant and its individual units survive and are capable of producing new parts the following spring or growth period.
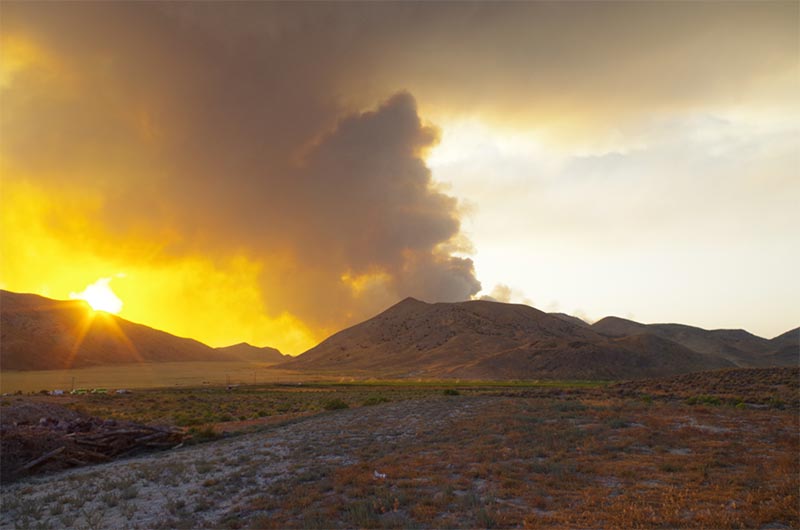 Figure 38. Rangeland fires have been recognized as a very significant threat to sagebrush and sage-grouse habitats.
 Figure 39. Vast expanses of annual vegetation may represent having crossed an ecological threshold that forces refocusing management strategies and rewriting objectives.
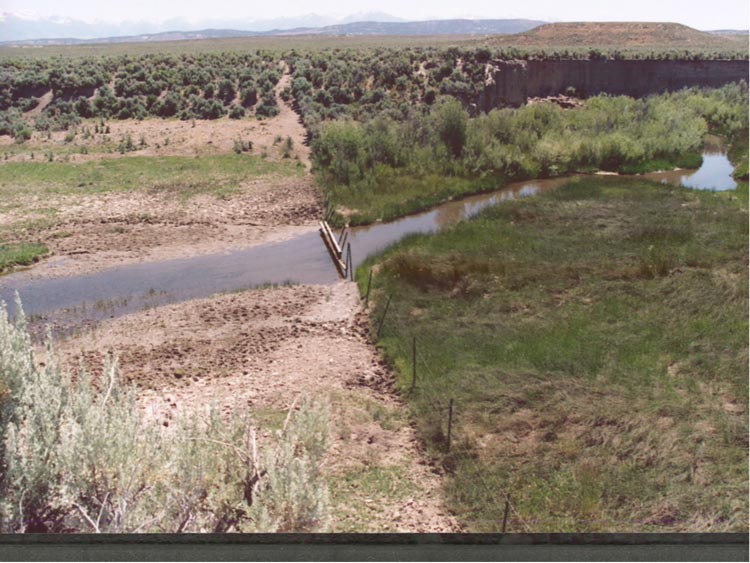 Figure 40. The edge of riparian or other exclosures may represent areas of concentrated use that are not representative or areas farther away.
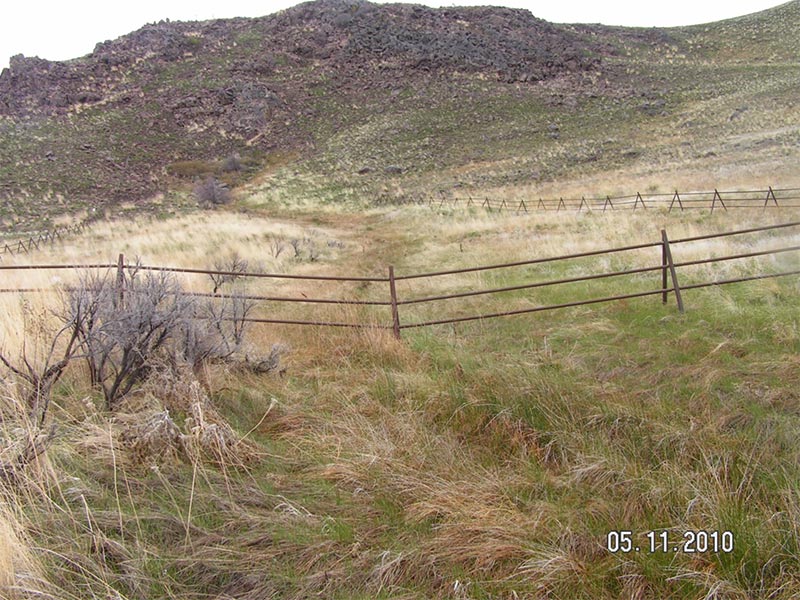 Figure 41. When areas out side exclosures are managed well, they may not look much different, or exclosures may show an abundance of thatch, fuel or other indicators of their lack of use.
Frequency
The number of times a preferred plant is defoliated during active growth, based on duration of grazing during a growing period
| Frequency |
Rating of Grazing Impacts |
| One |
+1 |
| Two |
0 |
| Three |
-1 |
Intensity
Leaf material remaining for growth
| Intensity |
Rating of Grazing Impacts |
| Light intensity >65% remaining |
+1 |
| Moderate 50-64% remaining |
0 |
| Heavy intensity <50% of leaf remaining |
-1 |
Opportunity
For growth or regrowth
| Intensity |
Rating of Grazing Impacts |
| Full season to grow |
+2 |
| Most of the season |
+1 |
| Some Chance |
0 |
| Little Chance |
-1 |
| No Chance |
-2 |
Apparent Trend
Trend is the direction of change in an attribute over time (Bedell 1998; NRCS 2003). Apparent trend refers to one-time observations of soil and vegetation conditions on rangelands. Apparent trend is determined for areas that lack measured trend data, or it can be used to supplement measured trend data. It relies on soil and vegetation indicators, which make it very similar to the more modern concept of rangeland health assessment (Pellant et al. 2005) described in the Inventory and Assessment of Base Resources section above. Recording apparent trend should only be done by an experienced observer and should always be clearly identified as apparent trend. Apparent trend indicators can be recorded when taking data at key areas. These observations should only be used to identify or focus on areas where additional monitoring and management may be necessary.
