Lumping or averaging species for utilization monitoring may miss key information. The exception is an area with several forage species of approximately equal palatability, production and grazing accessibility at the same time of year. Such circumstances are most likely to occur in wet meadows, riparian areas or seedings. Under these conditions, utilization may be judged for a community rather than for a key species. For example, degree-of-use of mountain meadow sites could be represented by an average use recorded on the part of the plant community that produces the bulk of the forage. Because vegetation is needed for riparian functions, specifically note the vegetation that relates to these functions, such as at the water’s edge, the greenline.
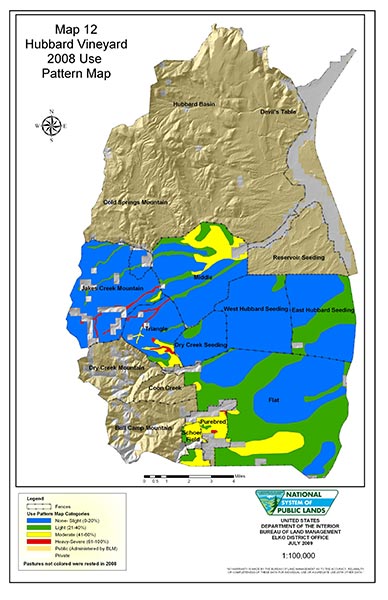 Figure 66. Distribution of grazing intensity can be influenced by season of use, weather, infrastructure, such as fences and location or number of waters, topography, stockmanship, placement of supplement, past use patterns, and animal selection or training. Mapping use patterns provides clues for management and selection of monitoring locations, as well as a record of use in a given year to interpret long-term monitoring.
Use patterns often remain similar from year to year for a variety of reasons. However, utilization patterns can change because of management actions including development of water, herding, season of use, culling, changing kind or class of livestock, etc. The number of years of data needed for interpretation varies depending on the variation from year to year. Once use patterns are understood, they may suggest management changes that should be considered to adjust the use pattern. These changes should be tied to objectives and opportunities for enhancing rangeland, plant or animal health. Management changes that affect distribution include use of stockmanship to place livestock, other herding, water locations, season of use, use or placement of supplements or salt, changing pasture size or shape, animal numbers, duration of grazing period, fire, vegetation type conversions, etc.
Key Species Method
The key species method (formerly the modified key forage plant method) is based on an ocular estimate of the amount of forage removed by weight on key species. This method is described in the interagency technical reference on utilization studies and residual measurements (BLM 1999b) and in the Ranchers’ Monitoring Guide (Perryman et al. 2006).
Training for this utilization method requires observers to compare their ocular observations of use with the clipped and weighed amount using ungrazed plants. Observations are recorded in one of seven utilization classes, as is common in use mapping. Utilization cages can be employed in conjunction with this method on key areas to provide reference plants to observe while reading a study or to clip while training. Utilization cages must be relocated annually to protect randomly chosen but representative plant(s) of the key species in similar growing conditions. The utilization determined on key areas is used in combination with actual use data, trend in species composition, use patterns, weather, and/or supplementary information to evaluate whether or not management changes are needed.
While key species utilization is broadly applicable, compare this method with other utilization/residual forage methods to choose the one that best addresses site-specific conditions and objectives. For example, residual vegetation is preferred in areas where vegetation is relatively evenly dispersed, such as meadows or where growing the next crop of annual brome grasses prevents transition to an even more degraded state. For guidance related to monitoring the use of woody plants, also see the Interagency Technical Reference “Utilization Studies and Residual Measurements” (BLM 1999b).
Proper Use
Proper use is a degree of utilization of current year’s growth that, if continued, will achieve objectives (Bedell 1998). Proper use is species specific. It may also be affected by the ecological site, state and phase, and varies to a great degree with neighboring plants, the opportunity for plants to grow or regrow, season of use, and duration and intensity of use.
Determination of key species and desired proper use is part of the planning process. Local specifications for acceptable degree of use should be based upon research data and on the experience of the manager and range user to achieve objectives. Considerations of proper use often drive targets for within season triggers and end-of-season indicators in allotment management or multiple-use management plans. Proper use, based on grazing management and setting, should be checked against trend data to determine if the current proper use is appropriate or needs adjustment.
