The RADARSAT-satellite (http://www.asc-csa.gc.ca/eng/satellites/radarsat2) flown by the Canadian Space Agency provides radar data from anywhere on the earth with 1m by 3m resolution. AIRBUS Defense & Space Pleiades-1A and 1B satellites provide resolutions of 70cm panchromatic and 2.8m multispectral data in 20km swaths throughout the world (http://www.satimaging corp.com/satellite-sensors/pleiades-1). They also provide post processing and elevation models of potential use for rangelands analysis. See Apollo Mapping for further information.
Rapid Eye; Geoeye-2; Worldview-1, 2 and 3; Quick Bird, and other satellites provide remotely sensed data for the world’s rangelands. Each satellite has different sensors and sensor systems.
Several companies — Harris MapMart (www.mapmart.com), Apollo Mapping referred to as The Image Hunters (www.apollomapping.com), Planet labs (www. Planet.com) and Space Imaging Corporation (http://www.satimagingcorp.com/) provide imagery from a number of these satellites including a variety of image types, such as panchromatic, multispectral, Lidar, 3-D Lidar, hyperspectral and others. Most companies provide a variety of services with their products, such as custom mosaics, elevation data, change monitoring, ortho images and other data sets. ESRI provides a web App (Earth Secrets demo App) using Landsat and ArcGIS at http://landsatappv1p3.s3-website-us-west-2.amazonaws.com/.
Planet Labs is unique and symbolic of the newest in satellite remote sensing. They design and launch small imaging satellites to cover the earth every day. Their satellites, called doves, have dimensions of 10cm by 10cm by 30cm and weigh 4 kg (whereas a Landsat Space Craft weighs 6 tons with dimension of 4m by 4m by 6m and costs $855 million dollars to launch). They have launched over 100 doves and plan on about 150 with 30 ground stations. The data are primarily panchromatic but have as low as 10cm pixels, although most data have 3-5m pixels. The satellites fly in low earth orbits (about 420 km). They are downloaded every day with three formats: unrectified imagery data intended for integration, preprocessed data intended for on-the-spot analysis or orthrectified analytic imagery data in bulk instantly available. Rapid eye is part of the Planet Labs system and provides 6.5m resolution at nadir and 5m when orthorectified.
Unmanned Aerial Vehicle (UAV) Systems
While satellite systems will be used extensively, many groups, companies and individuals are using Unmanned Aerial Vehicles (UAVs) or drones to provide remotely sensed data. Numerous universities have ongoing research projects developing applications for using UAVs for rangeland and agricultural applications. Most commercial systems provide vegetation analysis algorithms, such as the Normalized Difference Vegetation Index (NDVI).
PrecisionHawk (http://www.precisionhawk.com/) can provide high resolution data in several formats, including visual, thermal, multispectral, Lidar and hyperspectral. With 1.3 cm resolution and 2d and 3d pixels it is possible to measure and interpret details such as bare ground and many species. Imagery can be flown and then analyzed while in the field.
EagleEye (www.eagleeyedroneservice.com), and 3DR Mapping Drones (https//3dr.com) with high resolution, 3DR’s Aero-M and X8-M are fully automated and intelligent drone mapping platforms for easy, fast and accurate aerial data acquisition and analysis.
Quiet Creek (www.thequietcreek.com) provides Unmanned Aerial Mapping, including the eBee sensfly system with centimeter resolution, 2- and 3-d mapping, classification algorithms, and land management monitoring.
Another new system recently advertised is Parrot Disco. This system is a ready-to-fly fixed wing drone that can fly for up to 45 minutes. Embedded GPS provides way points. This drone can “loiter” around point with GPS coordinates and allows the operator to use immersive glasses to view the site in real time. See https://www.parrot.com/us/drones/parrot-disco#parrot-disco
Eagle Eye Company (www.eagleeyeimagery.com.au/) uses the 3DR Solo (http://3dr.com/solo-drone/) and a Gopro camera linked to an Ipad. The dji phantom 4 (http://www.dji.com/product/phantom-4) is a similar product.
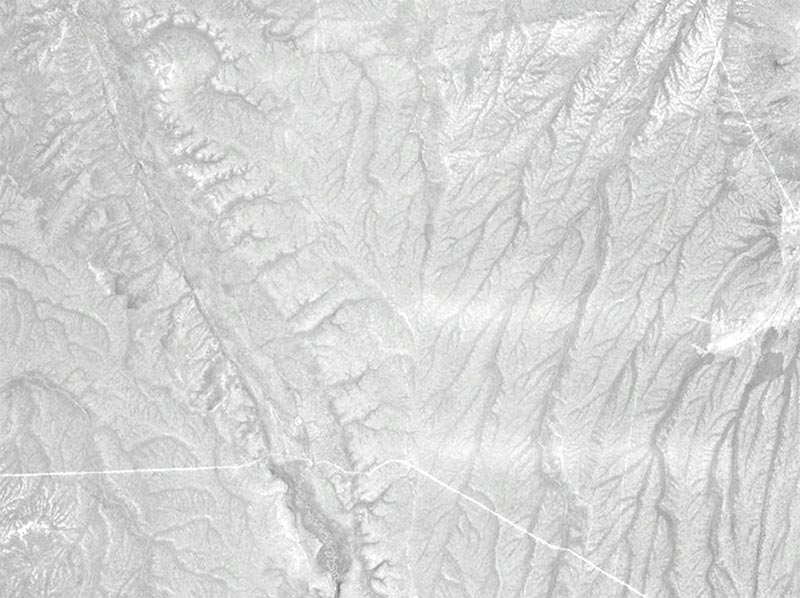 Figure 54. Images from Google Earth of a Nevada 2006 fire.
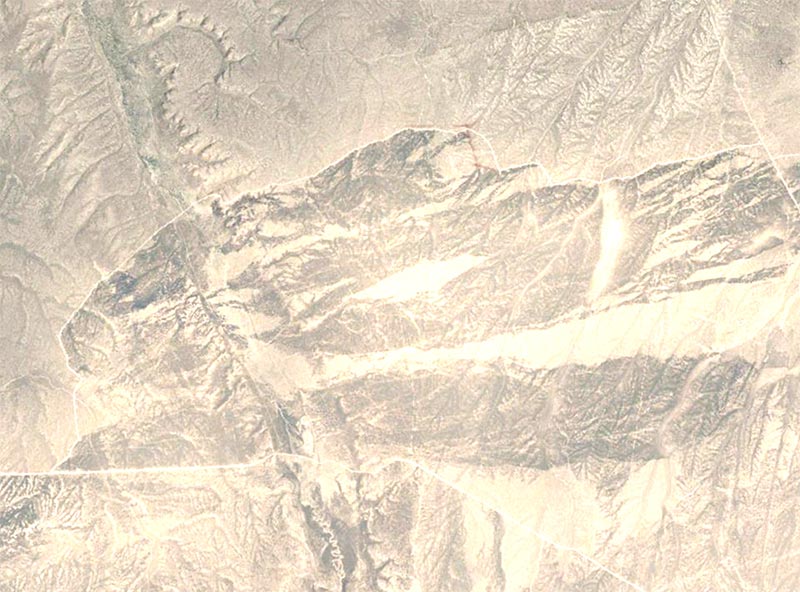 Figure 54. Images from Google Earth of a Nevada 2006 fire.
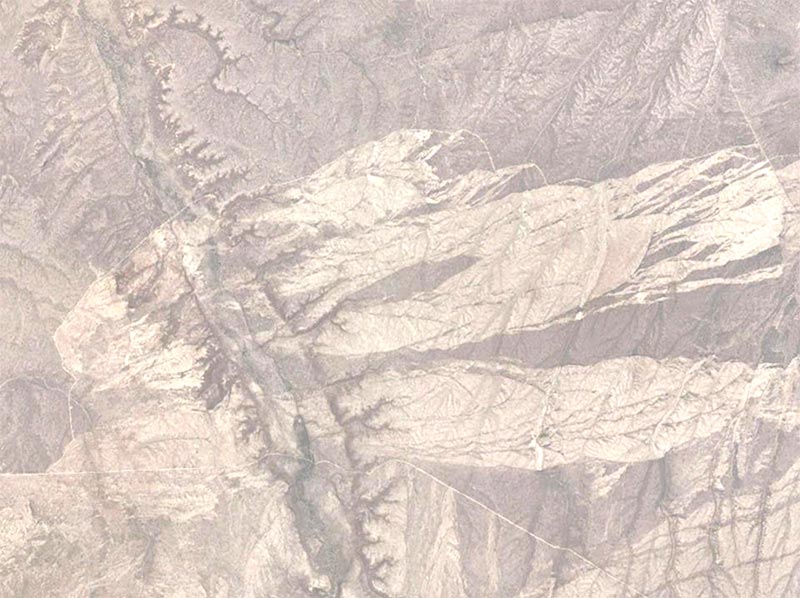 Figure 54. Images from Google Earth of a Nevada 2006 fire.
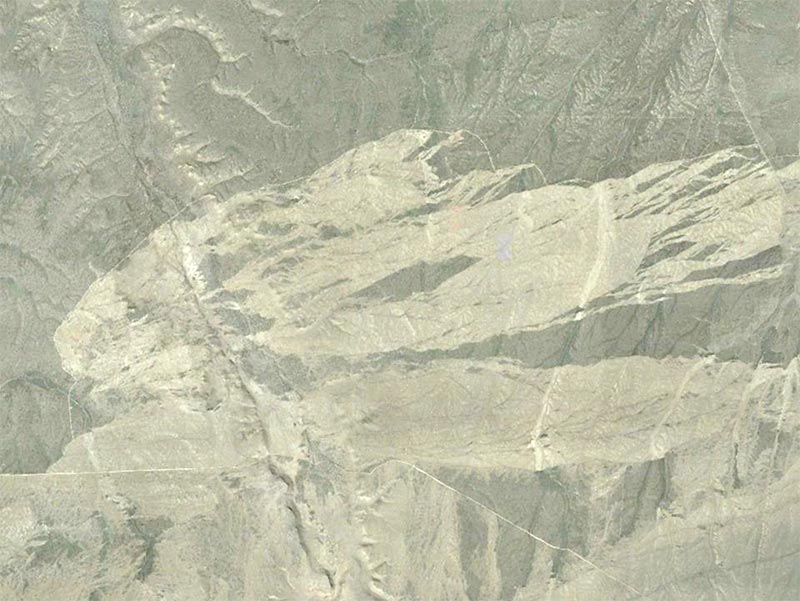 Figure 54. Images from Google Earth of a Nevada 2006 fire.
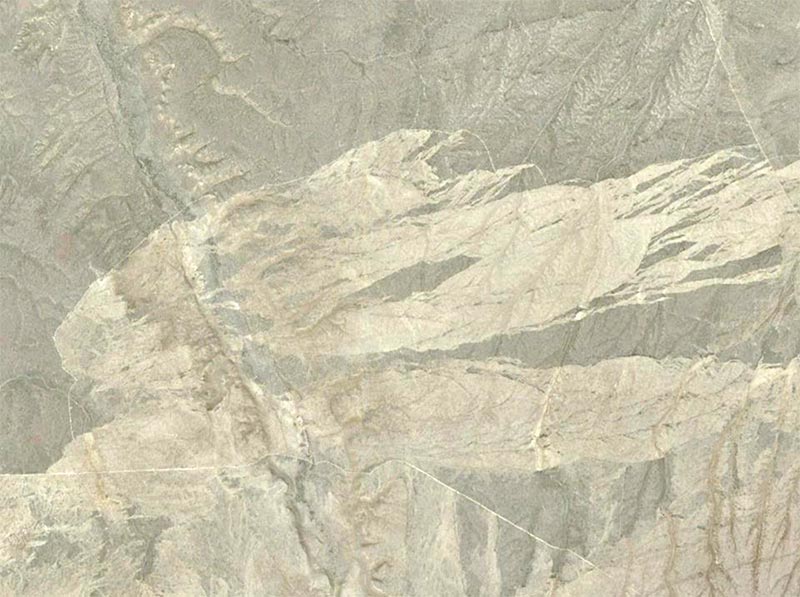 Figure 54. Images from Google Earth of a Nevada 2006 fire.
Many systems include both video and burst shooting where one to several frames can be captured and stored as high-quality imagery with sub-centimeter resolution for use with analysis algorithms. Prices for these systems vary but are approximately $2,500 to $3,000 for a complete system. Many people are intrigued with the idea of flying their own drone, storing the data, and doing the analysis and interpretation often with the flight ongoing. Data can be stored in a cloud for comparison and monitoring landscape changes. The battery power of many of these new technology drones provide around 28 minutes of flight time. With extra batteries, it is possible to examine six sites per day, including driving time to new locations. The data sites can be documented by GPS capabilities within the drone system. The imagery is panchromatic, and the resolution is as low as sub-centimeter. This allows interpretation of such things as bare ground, shrub species, perennial grasses and many forbs when sampled at the proper phenological stage. This, along with daily free imagery from the dove satellites mentioned earlier would provide a strong remotely sensed data set to monitor changes in upland and riparian vegetation. Also remember that the technology is changing very rapidly.
Arial Photography
Aerial photography is available from a number of sources. For example, for most states, high quality 1m-resolution color infrared imagery is available and obtained via the National Air Photo Program (NAPP), https://lta.cr.usgs.gov/NAPP every five to seven years. The USDA Farm Service Agency annually provides National Agriculture Imagery Program (NAIP) imagery, (http://www.fsa.usda.gov/programs-and-services/aerial-photography/imagery-programs/naip-imagery/).
Many companies provide aerial photography services including aerial acquisition, processing and orthoimaging (rectified to map quality) and light detection and ranging (LIDAR). LIDAR and Inferometric Synthetic Aperture Radar (IFSAR) can provide high-resolution three dimensional radar images useful for tree and shrub height or erosion/deposition along rivers with rapid terrain visualization. Aerial photography will continue to be used on rangelands, but the turnaround time will not be as useful as near real-time satellite data or rapid analysis using drone technology.
Ground Photography
Ground photography is an excellent tool for capturing short-term monitoring information. Photos taken after the use period show seasonal use, and photos at the end of the grazing and growing season show utilization or residual vegetation, or other end-of-season indicators. Photos may focus on streambank alteration or other management concerns that would show up well in a photo. Photos also capture long-term monitoring information and improve the interpretation of other long-term monitoring data. Photos must periodically be taken at key areas or designated monitoring areas. Photos can also be used to extend the application of ground vegetation cover sampling by interpreting aerial photos or satellite imagery (Sant et al. 2014). All photos should be carefully labeled (date and location) and stored for easy retrieval.
Photos also make an excellent record of riparian conditions to accompany long-term or short-term monitoring data. Photos are taken at times of stream survey and riparian proper functioning condition assessment. File photos can be used to identify suitable permanent photo points where they address objectives. Generally, riparian photo sets include upstream, downstream, and across-the-stream shots. Because riparian trends often lead to an abundance of willows or other riparian vegetation, later photos often show only a mass of vegetation hiding the stream. Therefore, it is often useful to take a photo from a station some distance from the riparian area, such as an overlook. In riparian areas, it is more important and more difficult to capture a part of the horizon or some unique feature, such as a tree or rock outcrop, to help with photo-point relocation.
Final Comment
To make remote sensing useful and to realize its great potential will require considerable effort by managers and ranchers to actually use this medium. Multiscale sampling procedures and software for processing photographic samples by automatic analysis is rapidly improving and will lead to applications with greater accuracy, consistency, precision and calibration. Remote sampling and automated image analysis apply at various scales for rangeland monitoring efforts. Those using remotely sensed data will have excellent sets of data in real time or near real time. For example, consider a heavy storm in which the question arises as to the damage to riparian sites that might have occurred. With real-time satellite data or user-obtained drone data, the next day one could determine just what has happened to the stream and the streamside vegetation. No waiting, an instance of land management analysis gratification. For further gratification, go to the numerous URLs mentioned above to visualize and be impressed by the variety of images useful for rangeland monitoring.
Providing the corporate or product names and URLs mentioned above does not constitute a recommendation or endorsement. They are simply examples of the kinds of products available. The right remote sensing tool (if any) depends on the needs and constraints of the user.
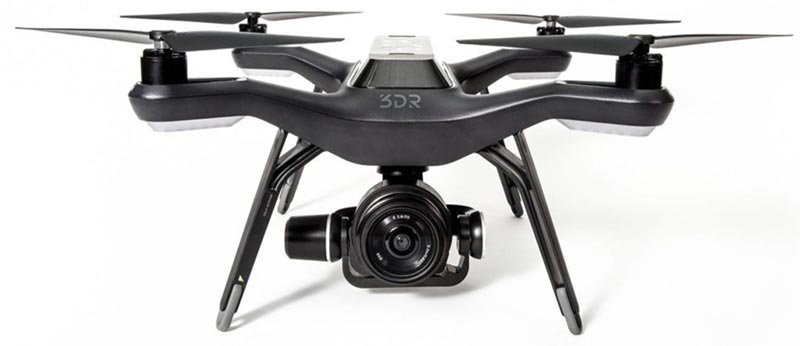 Figure 55. One of the many unmanned aerial vehicles in use for capturing aerial imagery.
Suggestions for Taking Better Photos
- Within the picture, identify the date and exact location using a field slate or form. See the Ranchers’ Monitoring Guide (Perryman et al. 2006).
- Take the picture during the same stage of plant growth (phenology) each year, if possible.
- Include the same skyline in the landscape photos.
- Consistently locate the photo points each time. This might be done using GPS technology, stakes in the foreground and a post to set the camera on, and taking previous photos into the field.
- Use the same lens or focal length lens and proper settings for light each time.
- Obtain one landscape photo and one or two close-up photos of the vegetation along each transect.
- For close-up photos, use a specific plot size and have a scale marker in the photo, such as a foot ruler or a pole with 6-inch color changes (e.g., red and white). Use similar procedures each time you retake each photo. These photos will be taken vertically over the plot or at a low oblique angle. Be consistent in how you obtain the photos. Digital cameras should be used since the images can be stored on the hard drive of your computer or a cloud, or can be placed on a CD for storage and future reference. It is good to record as much of what you can see as practical while in the field as experience has shown that it is difficult to recall all of the salient features of the site.
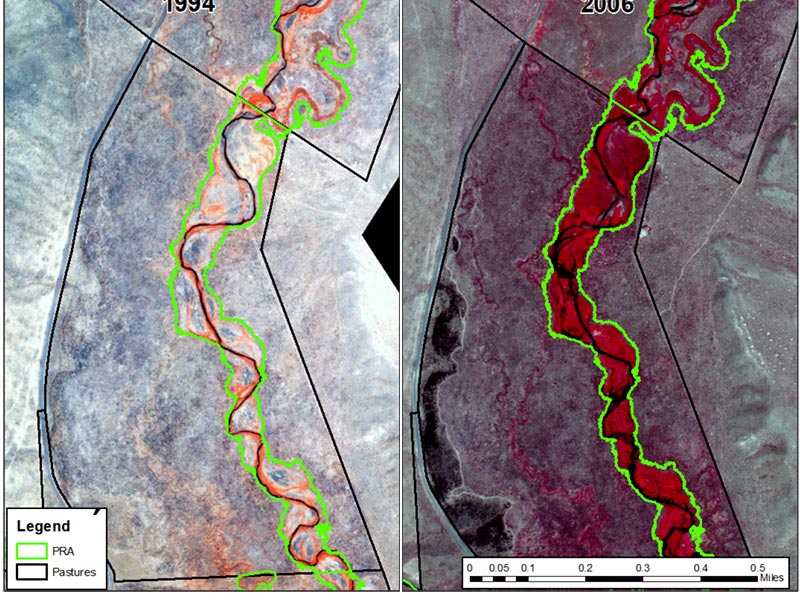 Figure 56. Riparian vegetation increased by 816 acres in the Maggie Creek Watershed Restoration area (Open Range Consulting and Newmont Mining Company 2009).
