Evaluation Matters | 2026-03
In this edition
- Beyond Luck!
- Spring Into Action: Building Healthy Data Management Habits
- Understanding Validity: Planting on Solid Ground
About Evaluation Matters
Evaluation Matters is a monthly newsletter published by University of Nevada, Reno Extension. It is designed to support Extension personnel and community partners in building practical skills for evaluating programs, making sense of data, and improving outcomes. Each issue focuses on a key concept or method in evaluation and provides clear explanations, examples, and tools that can be applied to real-world programs.
This issue focuses on three ways to build your evaluation work on solid ground: using the one-sample t-test to determine whether outcomes truly meet a benchmark, adopting practical habits for organizing, naming, and storing data, and understanding validity so that your tools measure what you intend to measure.
Beyond Luck!
Learn how the one-sample t-test helps determine whether your program outcomes truly meet the benchmark.
Each March, St. Patrick’s Day brings familiar themes of Ireland: lucky clovers, leprechauns, and pots of gold. Less widely recognized is that one of the foundational tools of modern statistics was born in Dublin, inside a Guinness Brewery. In the early 1900s, William Sealy Gosset was confronted with a practical challenge tied directly to judging beer quality. Guinness produced ale at enormous scale, yet quality decisions could not be based on evaluating entire vats. Instead, conclusions had to be drawn from small samples taken from much larger batches.
At the time, this created a serious analytical dilemma. There was no reliable way to determine whether measurements taken from a small sample truly reflected the characteristics of the full brew. Even when a sample value differed slightly from the company’s target standard, it was unclear whether this indicated a genuine issue in the larger vat or simply normal variation from sample to sample. Gosset’s solution was the development of the t-distribution, published under the pseudonym “Student” due to company policies restricting employee publications. His work provided a framework for evaluating whether a sample mean differed meaningfully from an expected value when variability had to be estimated from limited data.
This original problem remains deeply relevant to evaluation practice. Programs frequently operate under conditions where decisions must be made from samples rather than entire populations. Evaluators are often tasked with determining whether observed outcomes align with predefined targets, standards, or benchmarks. The one-sample t-test applies Gosset’s logic directly by evaluating whether the mean observed in a single group differs statistically from a known or hypothesized population value.
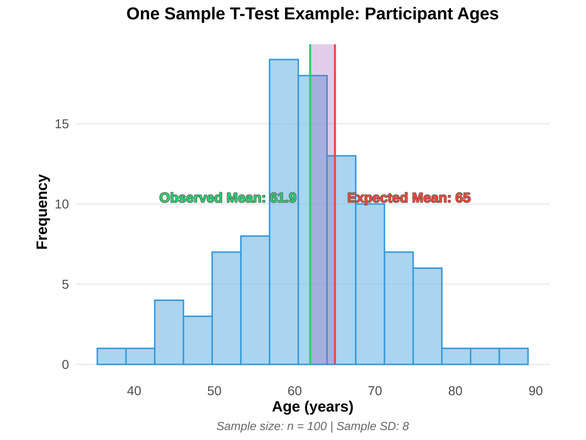
Consider a program serving older adults where the average age of participants is expected to be 65. After compiling registration data, the observed mean age of attendees is about 62. While the difference between expected and observed is straightforward to compute, its interpretation is less obvious. Does this gap indicate a meaningful difference in the population being reached, or could it reflect normal variation within the sample? The one-sample t-test provides a structured way to evaluate whether the observed mean differs statistically from the benchmark.
Benchmarks appear frequently in Extension and applied program settings. Outcomes may be compared against organizational targets, accreditation thresholds, prior-year averages, or minimum performance standards. In each case, the evaluator is assessing whether results meet expectations or deviate in meaningful ways. The one-sample t-test supports this process by incorporating the sample mean, variability, and sample size into a single statistical evaluation. This allows conclusions to rest on statistical probability rather than impressions.
While St. Patrick’s Day often celebrates luck, statistical inference depends on something more systematic. Gosset’s brewery-born innovation reminds us that statistics developed in response to real-world uncertainty, not abstract theory alone. More than a century later, evaluators continue to rely on the same principles when asking whether outcomes meet expectations.

William Sealy Gosset developed the t-distribution to judge beer quality from small samples at the Guinness Brewery.
Spring Into Action: Building Healthy Data Management Habits
Discover practical habits for organizing, naming, and storing your data so your work stays clear and reliable.
Spring is often associated with fresh starts and new growth. Workspaces are reorganized, inboxes are decluttered, and filing cabinets are reined in. The spring season encourages us to step back, reassess, and restore order to things that may have become difficult to navigate. Evaluation work benefits from the same mindset, particularly when it comes to managing data.
When files, spreadsheets, and surveys accumulate without structure, even simple tasks can become frustrating. Researchers may spend unnecessary time searching for the correct file, interpreting variable meanings, or understanding earlier decisions. If you’ve ever faced any of these struggles, it could be indicative of inconsistent organization. Establishing clear data management habits reduces confusion and supports smoother workflows throughout a project’s lifecycle.
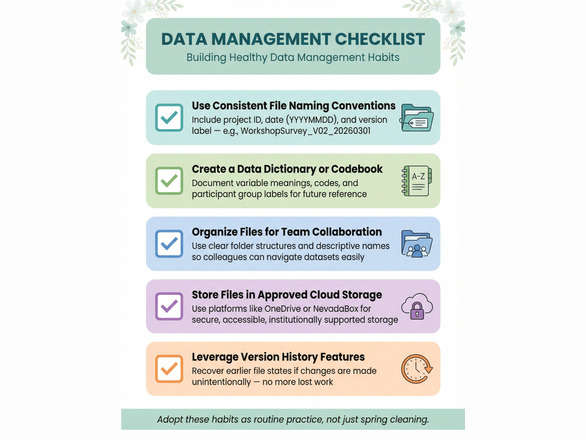
One foundational step is establishing predictable file naming conventions. Including project identifiers, dates, and version labels can help distinguish between iterations of the same dataset. Using date formats such as 20260301 (YYYYMMDD, where 2026 = year, 03 = month, 01 = day) ensures that files sort correctly and remain easy to interpret moving forward. Names like “WorkshopSurvey_V02_20260301” communicate substantially more than “data_FINAL.” Consistency in naming reduces errors, prevents accidental overwrites, and makes collaboration easier.
Maintaining good documents for a project is crucially important. Months after data collection, even the original analyst may struggle to remember whether “1” represented “Yes” or “No,” or which numeric code corresponded to which particular participant group. Taking a few minutes to create a simple data dictionary or codebook provides essential metadata, or information that describes and explains your data, which can make future analysis and interpretation much easier. These brief references help stakeholders interpret the dataset and serve as valuable guides when revisiting the data.
Clear organization becomes especially important when datasets are shared across teams. Colleagues who were not involved in the original data collection rely on filenames and documentation to understand what they are viewing. Inconsistent naming or missing descriptions can slow collaboration and increase the risk of misinterpretation. Structured systems support smoother handoffs and reduce unnecessary clarification requests.
Cloud-based storage offers another practical advantage for data organization and collaboration. Storing evaluation files in approved systems allows teams to access, update, and share materials from any location. UNR employees receive access to both OneDrive and NevadaBox, providing secure and institutionally supported storage options. These platforms also maintain built-in version histories, allowing users to recover earlier file states if changes are made unintentionally. Accidental overwrites no longer mean lost work, but a quick return to a prior version.
Data management may lack the excitement of analysis, but its impact is nevertheless substantial. Organized files, clear documentation, and consistent naming conventions can help reduce errors and save time throughout the evaluation process. By adopting these habits as routine practice rather than spring cleaning, evaluators build a foundation that supports clearer, faster, and more reliable work.
Understanding Validity: Planting on Solid Ground
Explore why measuring the right thing matters just as much as measuring it consistently.
In the last issue of Evaluation Matters, we discussed reliability and why consistent measurement matters for evaluation work. Reliability asks whether a tool produces consistent results across repeated measurements. If an instrument produces wildly different results under similar conditions, it becomes difficult to know what to trust. Reliability is therefore an important foundation for measurement; however, it is not the full story.
Validity is the partner concept that addresses meaning. Validity asks whether a tool is measuring what the evaluator intends to measure, and whether the conclusions drawn from the results are justified. An instrument can generate responses that appear orderly and consistent while still failing to capture the construct of interest. In those situations, the numbers may look dependable, yet they do not support the interpretation being made.
Reliability and validity are closely related, but they are not interchangeable. Reliability strengthens validity by reducing measurement noise and improving the stability of observed patterns. At the same time, reliability alone does not guarantee validity, while unreliable measurement makes validity far more difficult to establish and defend. Evaluators must therefore consider both concepts when designing instruments and interpreting results.
Consider a math test intended to measure a student’s ability to solve addition problems, and a question on a test that asks, “Do you enjoy doing math homework?” Students may answer this question consistently across repeated testing, producing highly reliable responses. However, the item measures attitudes toward math rather than mathematical ability. The test may appear to have validity across multiple measurements due to its high reliability, yet have little relevance in terms of measuring actual math skill.
This distinction is also reflected in the illustration below. Both farmers rely on rulers that would produce consistent measurements across repeated attempts, demonstrating reliability. Yet measurement consistency alone does not ensure that the tool meaningfully captures what matters. First, the ruler in question might be inaccurate and therefore would not be a valid instrument to measure distance. Second, a ruler might accurately measure plant height while offering limited insight into the broader construct of a plant’s health.
To further understand why the distinction between reliability and validity matters, it is helpful to recognize how easily a measurement tool can drift away from its intended purpose. A survey can yield participant responses that are consistent and yet unrelated to the topic of interest to the evaluator. Participants may respond based on item wording, ambiguous interpretation, or social desirability rather than the construct being assessed. Without attending to validity, evaluators risk reporting data that is stable but conceptually misaligned.
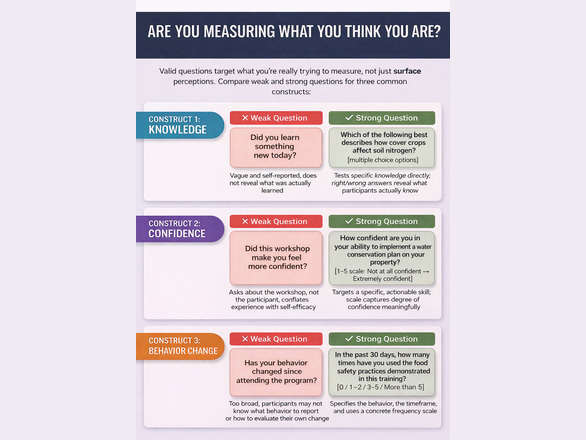
Validity also carries important implications for statistical analysis and research design. Statistical tests assume that variables meaningfully represent the concepts being examined. When validity is weak, even technically correct analyses will produce misleading conclusions. There is no statistical technique sophisticated enough to compensate for measures that fail to capture the constructs they are intended to assess. With that in mind, the next page has an infographic illustrating weak and strong questions used to measure an abstract concept.
Just as strong plants depend on healthy soil, sound evaluation depends on valid measurement. In assessment tools, reliability supports consistency, while validity supports meaning. Together, they form the foundation upon which statistical conclusions and program decisions are built. When both are carefully considered, evaluation findings become clearer, more credible, and more useful.
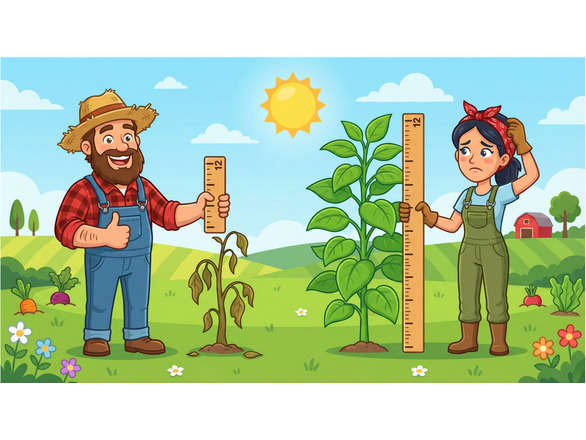
Both rulers measure consistently, but consistency alone does not mean a tool captures what matters.
Published by:
Copp, C. & Elgeberi, N., 2026, Evaluation Matters | 2026-03, Extension, University of Nevada, Reno, Newsletter
An EEO/AA Institution. Copyright © 2026, University of Nevada Cooperative Extension.
A partnership of Nevada counties; University of Nevada, Reno; and the U.S. Department of Agriculture