Land managers and fire professionals use predictions of wildfire behavior and probability to prepare for the fire season.
Predicting Wildfire Danger
You’ve likely seen the “Fire Danger Today” signs outside of local fire stations or ranger stations on public lands. Fire professionals determine these fire danger ratings by daily monitoring of the local environmental conditions, including weather and moisture of woody materials. This information is used by the National Fire Danger Rating System model to calculate the risk day-to-day and rank it from low to extreme.
But how do you determine the likelihood of wildfire for a particular area for the entire year versus a particular day? Fire professionals determine this by looking at the key drivers of fire in ecosystems.
Drivers of Fire in Ecosystems
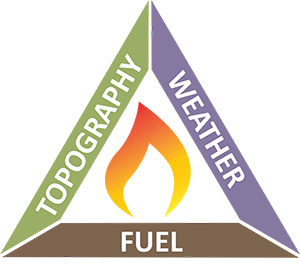
In the simplest sense, fire requires a source of heat, oxygen and fuel (i.e. anything combustible that can ignite). The fire behavior triangle (Figure 1) illustrates this basic concept with three main attributes. The three legs of this triangle are topography (the shape of a landscape), weather (wind, temperature and humidity), and fuel (living and dead vegetation as well as structures and other combustible debris) (Rizza, 2022). Scientists who predict wildfire assess how each of these factors impacts the chance of fire and how a fire might behave.
Figure 1. Fire Behavior Triangle.
In forested ecosystems, the types and quantities of trees and shrubs are mostly stable between years, so fire risk largely depends on the quality of these fuels, namely, how weather and climate conditions impact their moisture content across the season. Forests are therefore referred to as “condition-limited” systems because they have abundant fuels, and fire behavior is determined by the moisture levels of these fuels along with topography and weather.
In contrast, the Great Basin ecosystem has consistently arid conditions and shows greater year-to-year variability in the quantities and persistence of fine fuels, such as non-native grasses. These differences make the Great Basin’s grasslands and shrublands a “fuel-limited” ecosystem because fire behavior is largely determined by the amount of vegetation available to burn.
Key Drivers of Wildfire Probability in the Great Basin
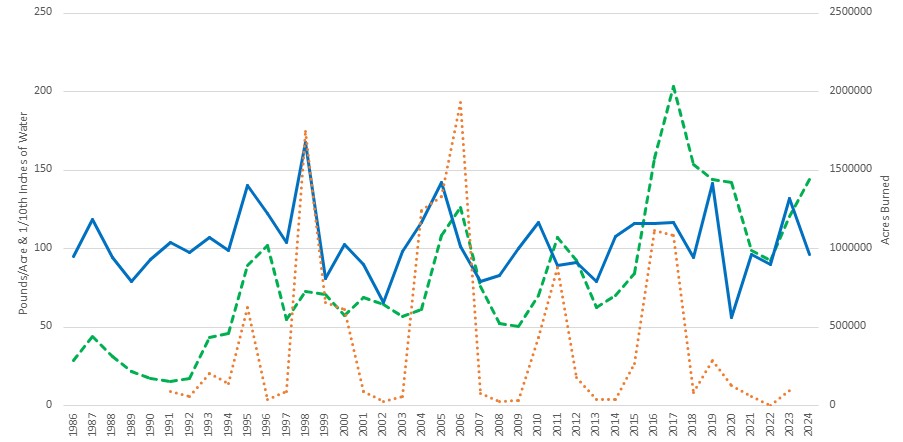
In Great Basin rangelands, there is a characteristic relationship between precipitation, vegetation growth and fire probability. Wet years increase the growth of plants, particularly annual grasses, most of which are not native to the Great Basin. Cheatgrass is a highly invasive non-native grass that grows well in disturbed areas, particularly after wet winters that yield conditions that promote germination. These grasses grow rapidly, dry early in the summer, and can accumulate as thick litter over several years. The cycle of increased vegetation growth during wet years followed by the drying and curing of dead plant material leads to an increase in fuel that is available to burn. Two wet years followed by a dry year is when rangelands experience the highest number of fires due to this increased vegetation (Figure 2).
Figure 2. Cycle of precipitation, grass growth, and acres burned by wildfires in Nevada. Wildfire area burned (orange) increases after increases in precipitation (blue) lead to annual grass production (green).
The buildup of cheatgrass has changed how fire behaves in sagebrush rangelands. In the absence of invasive grasses, sagebrush is interspersed with low numbers of perennial grasses and forbs, biocrusts and unvegetated soil. Invasive grasses grow between the shrubs and fill in the empty space, creating continuous fuels where fire moves readily from grass to shrubs, resulting in larger fires than would traditionally been seen in rangeland ecosystems. Because cheatgrass quickly recolonizes after fire, a grass-fire cycle can become established with fires burning every few years, ultimately creating vast grasslands in places that were once shrublands.
How does predicting fire in the Great Basin help land managers and communities?
Knowing the projected annual probability of wildfires within a region helps with planning and decision-making. Land managers are responsible for vast expanses of land and must make decisions about where to place wildland fire crews and equipment assigned to them. Locations that have a greater chance of fire in a particular year are likely to be designated as high-priority areas for staging these resources. Understanding what areas are likely to burn that year can also help prioritize where to use integrated pest management strategies, such as herbicides and targeted grazing, to reduce the volume of grasses.
Modeling and Machine Learning
Scientific models are tools built by scientists to help understand why systems and processes work the way they do. For mathematical models, scientists create a conceptual model of what affects a system. Then they create a mathematical model using data inputs that indicate these effects to see how well the model explains what they see in real life. Ultimately the model can be used to make predictions about the system.
Machine learning is a type of modeling. In machine learning, scientists program computers to learn more about patterns in datasets and then perform a task, such as making decisions or inferences, without explicit programming. It involves three iterative steps. First, the machine learning model is given data to find relationships and make predictions. Next, the program evaluates the errors in its predictions. Then it learns from the error and adjusts its predictions. Ultimately, the model can then make inferences, meaning it applies what was learned from its previous predictions and error analysis on data with known outcomes to new data inputs.
Learn More About How Models Predict Fire
The Rangeland Analysis Platform is a tool that predicts the amount of vegetation that will be in Great Basin rangelands each year. This mathematical computer model uses 18 datasets* as predictors of fire (including vegetation cover, plant growth data and climate data), along with 32 years of data for areas burned due to wildfires.
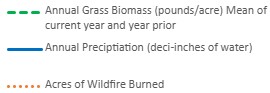
These datasets were first used by the model to learn the relative importance of each predictor in determining wildfires in a given year. After undergoing this calibration, the trained model was tested and evaluated, yielding the final model used each spring to predict the risk of wildfires greater than 1,000 acres across the Great Basin. It can be found at https://rangelands.app/great-basin-fire/.
The Rangeland Analysis Platform has determined the most important predictor of annual wildfire probability is the growth of fine fuels, including cheatgrass.
2025 Great Basin Rangeland Fire Probability map generated by the Rangeland Analysis Platform.
* The 18 datasets are annual forb and grass cover, perennial forb and grass cover, shrub cover, litter cover, bare ground cover, tree cover, annual forb and grass aboveground biomass production, perennial forb and grass aboveground biomass production, herbaceous aboveground biomass production, shrub net primary production, cumulative 16-d annual forb and grass aboveground biomass production, cumulative 16-d perennial forb and grass aboveground biomass production, Standardized Precipitation-Evapotranspiration Index, Evaporative Demand Drought Index, precipitation, cumulative growing degree days, mean annual temperature, and mean annual precipitation.
References
- Balch, J. K., Bradley, B. A., D’Antonio, C. M., & Gómez-Dans, J. (2013). Introduced annual grass increases regional fire activity across the arid western USA (1980–2009). Global change biology, 19(1), 173-183.
- Banoula, Mayank (2025, June 23) Machine Learning Steps: A Complete Guide. Simplilearn. https://www.simplilearn.com/tutorials/machine-learning-tutorial/machine-learning-steps
- Crist, M. R. (2023). Rethinking the focus on forest fires in federal wildland fire management: Landscape patterns and trends of non-forest and forest burned area. Journal of Environmental Management, 327, Article 116718. https://doi.org/10.1016/j.jenvman.2022.116718
- Kay, Megan. (2023, June 16) Predicting Fire in the Great Basin (Episode 13) [Audio podcast episode]. In Living With Fire Podcast. University of Nevada, Reno Extension Living With Fire Program. https://livingwithfirepodcast.buzzsprout.com/1819551/episodes/13052970-predicting-fire-in-the-great-basin
- Hanan, E. (2020) Megafires: Climate Change or Land Management? https://www.niskanencenter.org/megafires-climate-change-or-land-management/
- Pilliod, D. S., Welty, J. L., & Arkle, R. S. (2017). Refining the cheatgrass–fire cycle in the Great Basin: Precipitation timing and fine fuel composition predict wildfire trends. Ecology and Evolution, 7(19), 8126–8151. https://doi.org/10.1002/ece3.3414
- Renelle, Tyler (Host) (2017, February 11 and 15) MLG 004 Algorithms – Intuition [Audio podcast episode] and MLG 005 Linear Regression [Audio podcast episode] In Machine Learning Guide. https://podcasts.deptagency.com/mlg/mlg/4
- Rizza, J. (2022, January 18). Fire Behavior. OSU Extension Service. https://extension.oregonstate.edu/catalog/pub/em-9341-fire-behavior
- Smith, J. T., Allred, B. W., Boyd, C. S., Davies, K. W., Jones, M. O., Kleinhesselink, A. R., Maestas, J. D., & Naugle, D. E. (2023). Where There’s Smoke, There’s Fuel: Dynamic Vegetation Data Improve Predictions of Wildfire Hazard in the Great Basin. Rangeland Ecology & Management, 89(1), 20–32. https://doi.org/10.1016/j.rama.2022.07.005
- Strand, E. K., Blankenship, K., Gucker, C., Brunson, M., & MontBlanc, E. (2025). Changing fire regimes in the Great Basin USA. Ecosphere (Washington, D.C), 16(2). https://doi.org/10.1002/ecs2.70203
