Evaluation Matters | 2026-08
In this edition
- Rank Relationships
- Back to School Basics
- Falling Leaves, Hidden Patterns
- Labor of Collaboration
About Evaluation Matters
Evaluation Matters is a monthly newsletter published by University of Nevada, Reno Extension. It is designed to support Extension personnel and community partners in building practical skills for evaluating programs, making sense of data, and improving outcomes. Each issue focuses on a key concept or method in evaluation and provides clear explanations, examples, and tools that can be applied to real-world programs.
This issue focuses on four ways to strengthen evaluation practice: using Spearman’s rank correlation when the order of values matters more than their distance, training staff and volunteers to collect data you can trust, using exploratory data analysis to look at the data before the test, and working with community partners throughout an evaluation.
Rank Relationships
When Spearman’s rank correlation makes more sense than Pearson’s r.
In the June/July issue of Evaluation Matters, we discussed the Pearson correlation coefficient, often written as r, and how it helps describe the strength and direction of a relationship between two continuous variables. We also emphasized the importance of looking at the data rather than relying on the correlation coefficient alone. A scatterplot might reveal an unusual point, separate groups, or even a curved relationship that Pearson’s r does not describe particularly well. This month, we are continuing that conversation with a close relative of Pearson’s r: Spearman’s rank correlation.
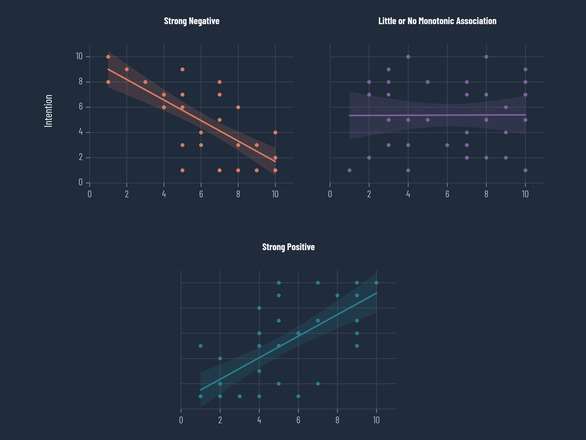
Spearman’s rank correlation coefficient, often called Spearman’s rho, answers a similar basic question (Spearman, 1904). When one variable increases, does the other generally tend to increase, decrease, or show no consistent pattern? Like Pearson’s r, Spearman’s rho ranges from -1 to +1. A positive value means that higher values on one variable tend to occur with higher values on the other. A negative value means that higher values on one tend to occur with lower values on the other. Values closer to either -1 or +1 indicate a stronger relationship. Values near zero indicate little monotonic association, although a curved or other nonmonotonic pattern may still be present.
The important difference is what Spearman uses to describe that relationship. Pearson’s r works with the actual numerical values in the data and is designed to describe a linear, or roughly straight-line, relationship. Spearman’s rho focuses instead on the order of those values. Rather than asking how far apart two scores are, it essentially asks where each observation ranks compared with the others. This makes Spearman especially useful when the order of responses is meaningful but the exact distance between them is not.
Imagine an evaluation where participants rate their confidence in using a new skill as low, moderate, high, or very high. Those categories clearly have an order, but we cannot assume that the distance between “low” and “moderate” confidence is exactly the same as the distance between “high” and “very high.” The values tell us who reported relatively more or less confidence, but they do not function like inches on a ruler. If the evaluator also measures participants’ intention to use the skill with another ordered scale, Spearman’s rho can examine whether people who rank higher in confidence also tend to rank higher in their intention to use what they learned.
Choosing between Pearson and Spearman therefore depends partly on how the variables were measured and what the relationship looks like. If both variables are numerical and the distances between values are meaningful, Pearson’s r is often appropriate. If the variables are ranks or ordered categories and if the numerical spacing should not be interpreted literally, Spearman’s rho may provide a better description.
As was noted with Pearson’s r, correlation still does not prove causation. A strong Spearman correlation between confidence and intention does not demonstrate that confidence caused participants to intend to use a skill. It tells us that the two tend to be ordered together. Other characteristics, experiences, or program factors may help explain why that relationship exists.
Pearson and Spearman are not competing versions of the same statistic as much as tools suited to different kinds of data. Pearson focuses on the numerical distance between values and the strength of a linear relationship. Spearman focuses on their order and whether that order moves consistently across two variables. Knowing how your data were measured, examining the pattern visually, and choosing the correlation that matches that pattern helps ensure that the relationship you report is the relationship your data can actually support.
References
Spearman, C. (1904). The proof and measurement of association between two things. The American Journal of Psychology, 15(1), 72–101. https://doi.org/10.2307/1412159

Spearman’s rank correlation works with the order of values rather than their exact distances.
Back to School Basics
Training staff to collect data you can trust.
The beginning of a school year is a reminder that even familiar tasks benefit from clear expectations. A teacher would not hand students an unfamiliar assignment without explaining what is expected, yet evaluation teams sometimes distribute surveys, observation forms, or attendance logs with very little instruction. A well-designed data collection tool can still produce weak data if the people using it interpret the process differently. Training helps turn a good instrument into a consistent procedure.
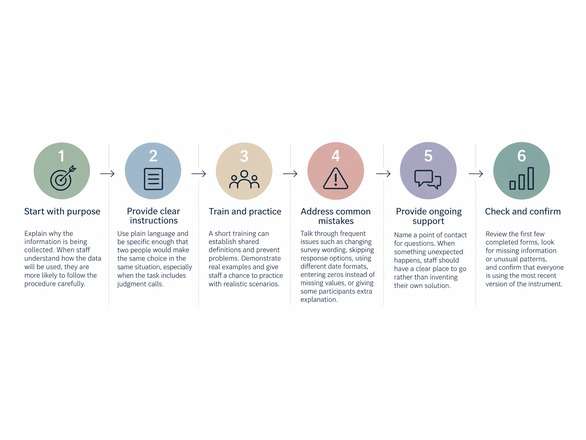
The first step is explaining why the information is being collected. Staff and volunteers are more likely to follow a procedure carefully when they understand how the data will be used. An attendance record may support reporting on program reach. A short survey may measure participants’ self-reported confidence or intention to use the skill; determining whether either changed requires an evaluation design suited to that question, such as comparable pre- and post-program measures. An observation form may document whether an activity was delivered as planned. Connecting the task to its purpose makes the instructions easier to understand and gives people a reason to pay attention to the details.
Instructions should be written in plain language and specific enough that two people would make the same choice in the same situation. This is especially important when the procedure includes judgment calls. For example, imagine that several program sites are recording attendance. One staff member counts anyone who signs in as having attended the session, while another counts only people who stay through the end. One person records absences with a value while another leaves the data blank. Many approaches could be reasonable, but combining these records later creates a dataset in which “attendance” does not mean the same thing everywhere.
A short training can reduce that risk by establishing a shared definition before data collection begins. The team might agree that attendance means participating in at least half of the session, explain how late arrivals should be recorded, and specify the difference between an absence and missing information. The trainer can demonstrate several examples and then let staff practice with realistic scenarios.
Practice is particularly valuable because written instructions cannot anticipate every situation. Walking through a survey administration or a mock interview might reveal questions that may otherwise surface only after data collection has started. Training should also address frequent mistakes, such as changing the wording of survey questions, skipping response options, using different date formats, entering zeros where information is actually missing, or giving some participants extra explanation that others do not receive. The goal is not to make the procedure complicated. It is to make the correct procedure easy to repeat.
Staff also need a clear place to go when something unexpected happens. Naming a point of contact prevents people from inventing their own solutions when instructions do not cover a situation. Simple quality checks can reinforce the same consistency. A supervisor might review the first few completed forms, compare totals across records, look for unusually high levels of missing information, or confirm that everyone is using the most recent version of the instrument. Catching a small problem early is much easier than repairing a full dataset later.
To be clear, data-quality problems are often not the mistake of the person who entered the information. If several people make the same mistake, the process itself may be unclear. Good training reduces ambiguity, gives people opportunities to ask questions, and creates shared expectations about what should happen. That supports staff as much as it supports the evaluator. A brief investment in explanation, practice, support, and quality checks can reduce uncertainty and make the final findings easier to trust. And improve data quality; evaluators should still document limitations and assess whether the evidence supports the conclusions.
Falling Leaves, Hidden Patterns
Why exploratory data analysis comes before the test.
Early fall has a way of making patterns easier to notice. A few changing leaves become a patch of color, and before long the landscape looks different than it did only weeks earlier. Data can work the same way. Individual values may not tell us much on their own, but patterns begin to emerge when we step back and look at the dataset as a whole. Exploratory data analysis is an approach that uses primarily graphical and descriptive techniques to increase understanding of a dataset, uncover its structure, detect anomalies, and assess underlying assumptions (National Institute of Standards and Technology [NIST], n.d.). Analyses or hypotheses generated after examining the data should be identified as exploratory and subsequently tested using new observations when possible (Nosek et al., 2018).
EDA is different from formal hypothesis testing. A statistical test evaluates a specific question about a difference, association, or change. Exploratory analysis comes earlier and serves a different purpose. It helps the evaluator understand the structure of the dataset, see how variables are distributed, notice relationships that may be worth investigating, and determine whether the assumptions behind a planned analysis are reasonable. EDA can point toward useful questions, but it does not establish that an observed pattern is statistically meaningful.
The first step is getting oriented to the dataset. Before running an analysis, you should identify what each variable represents, whether it is categorical or numerical, the range of values that should be possible, and the units or scale being used. It is also important to understand how missing information appears in the data. This is less about correcting the way information was collected and more about knowing what is actually available for analysis. A dataset becomes much easier to interpret once the evaluator understands what each column means and what kinds of values it contains.
Next, look at variables one at a time. For categorical variables, counts and percentages help show how observations are distributed across groups. A bar chart can quickly reveal whether one category is much more common than another. For numerical variables, an appropriate average provides a useful summary, but it should be paired with a view of the distribution. Histograms and box plots can show whether scores are tightly clustered, widely spread, skewed toward one end, or affected by unusually high or low observations. Two variables can have the same average and still have very different distributions.
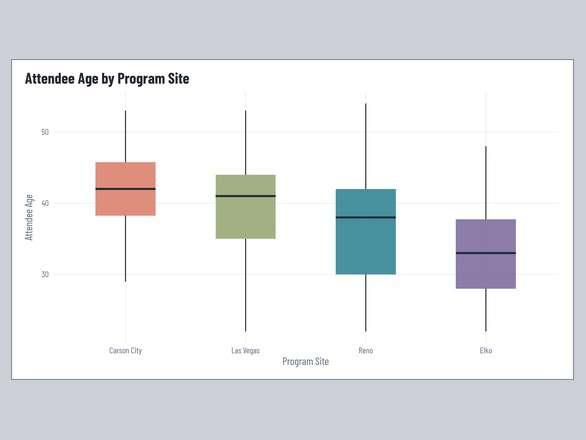
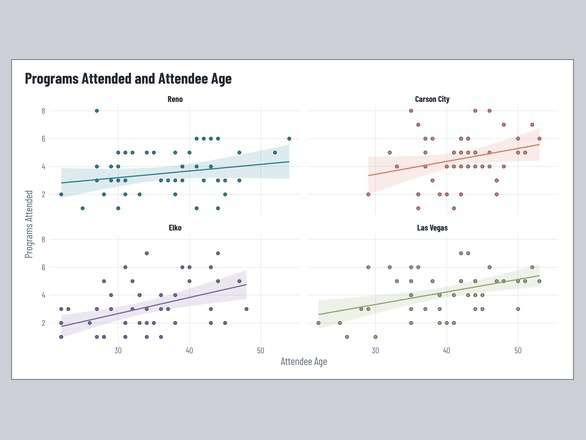
The next step is to examine how variables relate to one another. Scatterplots are useful for two numerical variables because they show whether higher values on one measure tend to occur with higher or lower values on another. Grouped box plots can compare a numerical outcome across categories such as program sites or participant groups. (To learn more about box plots, see our November 2025 issue of Evaluation Matters!) These displays often provide information that a single summary statistic cannot. A relationship may be curved rather than linear, concentrated within one subgroup, or influenced by only a few observations.
Some patterns deserve particular attention before moving into formal analysis. Missing responses may be concentrated among particular participants or measures. An impossible value should be investigated before it is included in calculations. An outlier may represent an error, but it may also be a legitimate observation that tells an important part of the story. Strongly skewed distributions may make some statistical methods less appropriate, while floor and ceiling effects can limit the amount of change a measure is able to capture. The purpose of EDA is not to automatically remove unusual observations. It is to understand what they mean before deciding how to proceed.
Imagine reviewing data from a workshop series that includes attendance, knowledge scores, satisfaction ratings, and participant characteristics. A histogram might show that nearly every participant selected the highest satisfaction rating, suggesting a ceiling effect and very little ability to distinguish among participants. A scatterplot might show that knowledge scores increase with attendance at first but then level off, suggesting that the relationship is not simply linear. A grouped box plot might reveal that one program site has much greater variation in knowledge scores than the others. None of these observations provides a final answer, but each one affects what analysis would make sense next.
EDA can also prevent evaluators from asking the wrong statistical question. If two variables show no meaningful variation, a correlation may have little to work with. If groups have very different spreads, a standard comparison of means may require additional consideration. If a scatterplot shows a curved relationship, a straight-line model may not describe it well. EDA can reveal when a planned model is a poor fit or when its assumptions need attention. Primary evaluation questions and analyses should be planned before data collection; analyses prompted by patterns found in the data should be reported as exploratory.
Exploratory data analysis is therefore not an extra step between data collection and statistical testing. It is part of making the test itself more appropriate. By examining distributions, relationships, unusual observations, and the overall structure of the dataset, evaluators can make better decisions about what to analyze and how to interpret the results. Looking first and testing second helps ensure that later conclusions are based not only on the statistical output, but on a clear understanding of the data that produced it.
References
National Institute of Standards and Technology. (n.d.). What is exploratory data analysis? In NIST/SEMATECH e-handbook of statistical methods. https://www.itl.nist.gov/div898/handbook/eda/section1/eda11.htm
Nosek, B. A., Ebersole, C. R., DeHaven, A. C., & Mellor, D. T. (2018). The preregistration revolution. Proceedings of the National Academy of Sciences of the United States of America, 115(11), 2600–2606. https://doi.org/10.1073/pnas.1708274114
Labor of Collaboration
Working with community partners in evaluation.
Labor Day offers a natural reminder that worthwhile work is rarely accomplished alone. Evaluation is no different. Community partners are sometimes brought into the process near the end, perhaps to distribute a survey, recruit participants, or review a finished report. Those contributions can be helpful, but meaningful collaboration begins earlier. Partners who understand the people, places, and programs being evaluated can contribute knowledge that changes what the evaluation asks, how information is collected, and what the findings ultimately mean.
Community partners often understand local context in ways that an evaluation team cannot learn from a spreadsheet. They may know which words carry different meanings, which outreach methods people actually use, which times of year make participation difficult, or which outcomes community members consider most important. That knowledge can improve technical decisions as well as relationships. Involving partners early can help ensure that the evaluation is measuring something relevant rather than simply something convenient.
One useful place for collaboration is the development of evaluation questions. Program staff may initially focus on outcomes tied closely to the activities they deliver, while community partners may identify changes that matter more to participants. Partners can also help determine which outcomes are realistic within the program timeframe and which questions may feel intrusive or poorly matched to the audience. Their involvement does not mean abandoning the program’s goals, but rather considering those goals alongside the experiences of people who understand how the program operates in practice.
Collaboration can continue through decisions about data collection. Partners may recommend a different survey format, suggest using an existing gathering instead of creating a new event, identify trusted people who can introduce the evaluation, or point out that a planned schedule conflicts with work, family, agricultural, or community obligations. They can also help evaluators interpret findings. A result that appears surprising from outside a community may make immediate sense to someone familiar with local conditions.
To illustrate, imagine an evaluation team planning to measure the success of a family education program primarily through attendance and a short online follow-up survey. During planning, a community partner explains that transportation challenges make consistent attendance difficult and that many families consider successfully using the program’s resources at home a more meaningful sign of success. The partner also notes that an online survey sent several weeks later is unlikely to reach many participants. The team responds by adding a practical-use outcome and collecting brief follow-up information during an existing community event. The evaluation question has not been handed over entirely, but community knowledge has materially improved the plan.
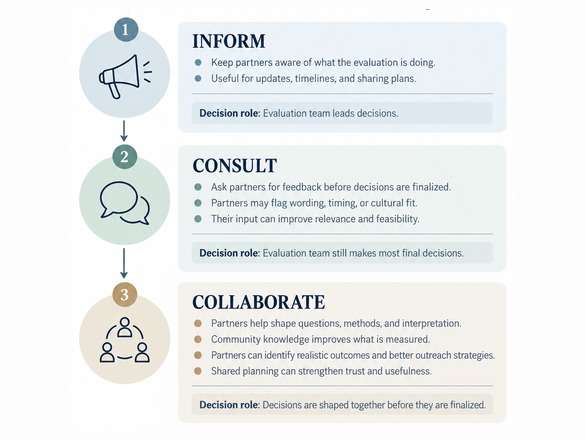
It is useful to distinguish collaboration from simply informing or consulting. Informing means keeping people aware of what is happening. Consulting means asking for feedback while the evaluation team retains most of the decision-making authority. Collaboration means partners have a meaningful role in shaping decisions before they are finalized. In some projects, communities may have even greater authority over priorities, interpretation, or how findings are used. The appropriate level will vary depending on the program, the relationship, available time, responsibilities, and the decisions being made.
Not every evaluation requires the same level of shared decision-making, but every evaluation can benefit from asking who should have a voice and when that voice would be most useful. Bringing community knowledge into the process can strengthen relevance, interpretation, and trust. The goal is not simply to conduct an evaluation in a community. It is to build an evaluation with the people who understand that community well enough to help the findings become genuinely useful.
Published by:
Copp, C. & Elgeberi, N., 2026, Evaluation Matters | 2026-08, Extension, University of Nevada, Reno, Newsletter
An EEO/AA Institution. Copyright © 2026, University of Nevada Cooperative Extension.
A partnership of Nevada counties; University of Nevada, Reno; and the U.S. Department of Agriculture
