Evaluation Matters | 2026-05
In this edition
- The Mother of All Comparison Tests
- Weathering the Storm
- Leaving No One Behind
About Evaluation Matters
Evaluation Matters is a monthly newsletter published by the University of Nevada, Reno Extension. It is designed to support Extension personnel and community partners in building practical skills for evaluating programs, making sense of data, and improving outcomes. Each issue focuses on a key concept or method in evaluation and provides clear explanations, examples, and tools that can be applied to real-world programs.
This issue focuses on three ways to strengthen evaluation practice: using ANOVA to compare three or more groups with a single overall test, interpreting and reporting non-significant results with care, and designing culturally responsive evaluations that fit the communities they serve.
The Mother of All Comparison Tests
Learn how ANOVA helps compare three or more groups at once without getting tangled in too many separate t-tests.
In recent issues, we have discussed several members of the t-test family. We started with the independent-samples t-test, which helps compare the average scores of two separate groups. Then we moved to the paired t-test, which is useful when measuring change in the same participants over time. We also discussed one-sample t-tests, which compare one group average to a known or expected value. Together, these tests are useful tools for answering common evaluation questions, especially when the comparison is focused and the groups are limited.
But what happens when an evaluation question includes more than two groups? Maybe a team wants to compare satisfaction scores across three workshop formats, knowledge gains across four counties, or participant outcomes across several program sites. At that point, the question is no longer limited to a single comparison. The evaluator needs a way to assess whether meaningful differences exist across several groups at once.
This is where ANOVA comes in. ANOVA, short for analysis of variance, is most often introduced as a tool for comparing the average scores of three or more groups at the same time. Technically, ANOVA can also be used with only two groups, in which case it produces the same statistical conclusion as an independent-samples t-test. However, its value becomes especially clear when an evaluation question includes several groups because it allows the evaluator to begin with one overall test rather than running many separate comparisons. Instead of asking whether Group A is different from Group B, whether Group A is different from Group C, and then whether Group B is different from Group C, ANOVA begins with a broader question: how much variation exists between the group averages compared to the variation within each group? Learning about ANOVA is a natural next step after the t-test family because it extends the logic of comparing means to situations with multiple groups.
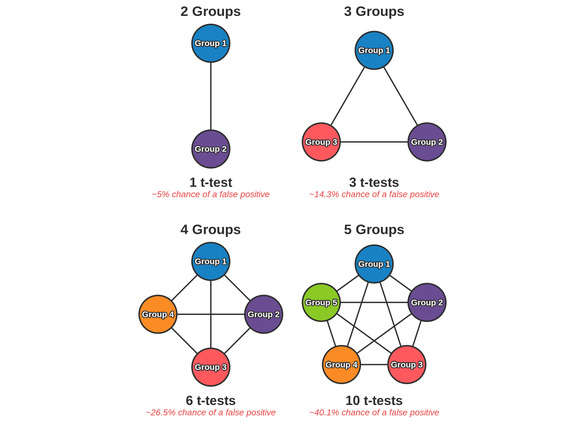
At first, running several t-tests might seem like a straightforward solution. The problem is that each statistical test carries some chance of producing a false positive, meaning it may suggest a difference exists even when the pattern is solely due to random variation. As shown in the infographic, the number of pairwise comparisons grows quickly as more groups are added. Two groups require only one comparison, but three groups require three comparisons, four groups require six, and five groups require ten. If each test carries about a 5% chance of a false positive, the overall likelihood of finding at least one false positive increases as comparisons accumulate. Before long, the analysis becomes complicated and the results become harder to interpret with confidence.
ANOVA addresses this problem by beginning with a single overall test, often called an omnibus test. Rather than testing every pair of groups separately at the start, it compares two kinds of variation: between-group variation and within-group variation. Between-group variation reflects how far apart the group averages are from one another, while within-group variation reflects how spread out the individual scores are inside each group. This matters because real-world data are always a little noisy. Participants within the same program may have different experiences, starting points, and responses to the same activity. The main statistic produced by ANOVA, called the F-statistic, summarizes whether the variation between group averages is large relative to the variation within the groups themselves.
For example, imagine an evaluator comparing satisfaction scores across four workshop formats: online, in-person, hybrid, and self-paced. If all four formats have similar average satisfaction scores, ANOVA will likely suggest that there is not strong evidence of a difference among them. If one format has a much higher average than the others, and participants within each format respond fairly consistently, ANOVA may indicate that the group differences are statistically significant. In plain language, this means the observed differences among the workshop formats are larger than we would expect from normal variation alone.
A significant ANOVA result tells us that at least one group differs from at least one other group, but it does not tell us exactly which groups are different. This is an important point. ANOVA answers the overall question first: are the group means different enough to pay attention to? If the answer is yes, evaluators often follow up with additional comparisons, sometimes called post-hoc tests, to identify where the differences are located.
ANOVA also depends on several assumptions that help determine whether the test is appropriate. In general, the outcome being compared should be approximately normally distributed within each group, the groups should have roughly similar levels of variance, and each observation should be independent of the others. In evaluation practice, this means the scores from one participant should not influence the scores from another participant, and no group should be much more spread out or inconsistent than the others. These assumptions do not need to be perfect in every real-world dataset, but they should be checked before interpreting the results too strongly, especially when sample sizes are small or when the groups differ substantially in size or variability.
Like all statistical tools, ANOVA should be interpreted alongside context. A statistically significant result does not automatically mean the difference is large, important, or useful for decision-making. Evaluators should also consider the size of the differences, the number of participants in each group, the consistency of responses, and what the results mean for the program. When used thoughtfully, ANOVA helps evaluators compare several groups at once while keeping the analysis organized and aligned with the broader evaluation question.

ANOVA begins with one overall test to compare the averages of three or more groups at the same time.
Weathering the Storm
See how non-significant results can still offer useful insight when interpreted with care.
Not every evaluation produces clear, sunny results. Sometimes the numbers point in the expected direction, but the statistical test does not reach significance. This can feel disappointing, especially when a program team has invested time, effort, and care into delivering services. But a non-significant finding is not a failure. It is still a result, and when interpreted carefully, it can still provide useful information.
A common mistake is to treat a non-significant p-value as proof that nothing happened. In statistical terms, that is not quite right. A non-significant result means the analysis did not find strong enough evidence to conclude that an effect or difference exists. That is different from proving there was no effect at all. For example, if a program’s average pre-test score increased from 70 to 74 after a workshop, but the p-value was greater than .05, we would not necessarily say the program had no effect. A more careful interpretation would be that the data did not provide enough evidence to conclude that the observed increase was statistically significant.
This distinction matters because evaluation data are shaped by many factors. Sample size, measurement quality, participant variation, and the size of the observed change all influence whether a result reaches statistical significance. A small program with only a few participants may show a meaningful-looking increase, but still have too little data to detect the change statistically. A larger program may have enough data to detect even small differences, but those differences may not matter much in practice. The p-value is useful, but it is not the whole forecast.
As we have discussed in previous issues, p-values rarely tell the whole story by themselves. Effect sizes help us think about whether a result is large enough to matter in practice, while confidence intervals show how much uncertainty surrounds the estimate. These terms become especially relevant when a result is not statistically significant, because two non-significant findings can have entirely different meanings.
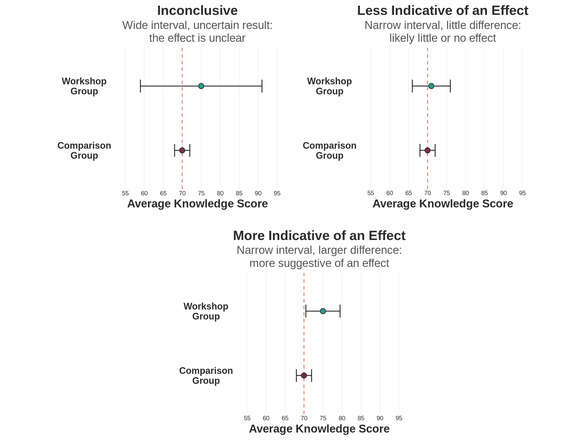
The accompanying visual shows three possible patterns. In the first panel, the workshop group has a higher average knowledge score than the comparison group, but the confidence interval is wide. This makes the result inconclusive because the measurement is uncertain and could shift with more data. In the second panel, the workshop group is only slightly higher than the comparison group, and the confidence intervals are narrow. This suggests the measurement is more precise, and that any difference between the two groups is likely limited.
In the third panel, the workshop group average is slightly higher and the confidence interval is narrow, but still includes zero. This pattern is the most informative of the three: the precise, narrow interval allows us to conclude with confidence that any true difference between groups is likely very small. Rather than indicating a real effect, this result helps evaluators rule out large effects, which is itself a meaningful finding.
Additionally, with 50 participants per group, the difference between the workshop group and comparison group in panel three is non-significant (p = .51). With only one more participant added to the workshop group, the p-value drops below .05, achieving statistical significance.
When reporting non-significant findings, it is helpful to use careful, plain language. Instead of writing, “The program had no impact,” consider writing, “The analysis did not find statistically significant evidence of change.” Instead of saying, “There was no difference between groups,” say, “The observed difference between groups was not statistically significant.” These small wording choices matter because they avoid overstating what the analysis can support. They also leave room for context, especially when the data suggests an effect but the evidence is uncertain.
Non-significant results can also be useful for program improvement. They may point to areas where a program needs more time, stronger implementation, better measurement, or a larger sample before outcomes can be detected. They may also suggest that the program is working for some participants but not others, which could lead to additional subgroup analysis or qualitative follow-up. In some cases, non-significant findings may help teams reconsider whether the selected outcome was the right one to measure. A cloudy result can still guide the next decision.
The key is to report non-significant findings honestly without treating them as empty. Evaluation is not only about confirming success. It is also about learning what the evidence does and does not show. By looking beyond the p-value, evaluators can describe uncertain findings with greater care. Even when the skies are gray, thoughtful interpretation can help teams see their path forward.
Leaving No One Behind
Explore practical ways to design evaluations that better fit the communities they serve.
In May, Memorial Day invites reflection on service, remembrance, and the importance of honoring people whose experiences can too often be overlooked. Evaluation carries a related responsibility: making sure the communities served by a program have a meaningful opportunity to shape how that program is understood. For Extension professionals in Nevada, this means recognizing that communities across the state may experience programs, institutions, and data collection requests differently. What works well for one group may not work well for another. A survey that feels convenient in one setting may feel inaccessible, impersonal, or poorly matched somewhere else. Culturally responsive evaluation asks us to consider these differences before data collection begins, so the evaluation is built around the community rather than forcing every community into the same process.
This matters in a state like Nevada, where local context can shape whether people participate at all. For example, Extension staff may find that some rural residents are cautious about requests that appear to come from government agencies, universities, or other state institutions. That skepticism is not simply a response-rate problem. It reflects history, relationships, and trust. If an evaluator sends a generic survey link from an unfamiliar office, some residents may ignore it, not because they have nothing to say, but because they are unsure who is asking, how the information will be used, or whether their feedback will make any difference.
In those situations, increasing participation may require more than a reminder email. Local relationships matter. A request shared by a county Extension educator, a 4-H leader, a community health worker, a producer group, or another trusted local contact may carry more weight than a message from someone unfamiliar. The invitation should also explain why the feedback matters, how the results will be used, and what will happen after the data are collected. People are more likely to participate when the request feels connected to their community rather than extracted from it.
Format, timing, and setting all shape who responds. Asking people to complete a survey during a busy agricultural season, after a long workshop, or through an email account they rarely check may limit participation before a single question is answered. In rural areas, internet access can make online surveys a poor fit. Some audiences may need materials in Spanish, larger print, or the option to respond verbally. In many cases, the better approach is simply to bring paper copies to an existing community meeting and meet people where they already are.
The accompanying visual highlights three considerations that can help Extension professionals plan evaluations that are responsive to community context: evaluation standards, program goals, and community needs. Evaluation standards help ensure the work is systematic and credible. Program goals keep the evaluation focused on what the project is trying to accomplish. Community needs help ensure the methods, questions, timing, and interpretation reflect the people most affected by the work. While this visual is not a formal model of culturally responsive evaluation, these three areas offer a useful starting point for thinking about how technical quality, program purpose, and community context can work together. When all three are considered during evaluation planning, the findings are more likely to be both trustworthy and useful.
Culturally responsive evaluation also shapes how results are interpreted. A low response rate in one county may not mean residents are uninterested. It may mean the survey was distributed through the wrong channel, introduced by the wrong messenger, or offered in a format that did not fit the audience. Differences in outcomes across communities may reflect implementation challenges, but they may also reflect challenges in distance, staffing, transportation, broadband access, or local economic conditions. Before drawing conclusions, evaluators should ask what community context might help explain the pattern.
Leaving no one behind in evaluation means designing your program with participation, context, and use in mind. For Extension, this often starts with practical choices: ask local staff what will work, use trusted messengers, offer more than one way to respond, keep materials clear, and share findings back with the communities that contributed. These steps do not make evaluation less rigorous. They make it more accurate, more respectful, and more useful. When communities help shape an evaluation, the results are more likely to reflect experiences from the whole population, rather than the voices that were easiest to reach.
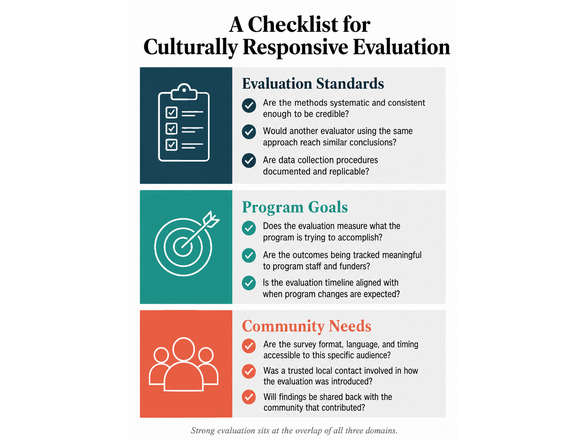
Evaluation standards, program goals, and community needs work together to shape culturally responsive evaluation.

Published by:
Copp, C. & Elgeberi, N., 2026, Evaluation Matters | 2026-05, Extension, University of Nevada, Reno, Newsletter
An EEO/AA Institution. Copyright © 2026, University of Nevada Cooperative Extension.
A partnership of Nevada counties; University of Nevada, Reno; and the U.S. Department of Agriculture