Economic Indicators for Nevada Elders
Introduction
In 2011, the first members of the baby boom generation born after World War II will start turning 65. The share of the population that is 65 years or older will become higher than has ever been experienced in U.S. history. Businesses, government and private households will all be affected by and need to prepare for these large demographic shifts. In order to help with this preparation, Factsheet-09-10 examines some basic economic indicators for current Nevada seniors and the upcoming baby boom generation.
Income
Nevada senior households had higher incomes than their U.S. counterparts. Between 2005 and 2007, Nevada senior households had a median income of about $37,000, 18 percent higher than the national median of $31,000. The baby boomer generation, currently in the 45 to 64 year old age group and in its peak earning years, has median earnings of about $61,000 in Nevada. Baby boomers in Douglas and Elko had the highest median income among Nevada counties.
Table 1. Median Annual Household Income by Age of Householder, 2005‐2007 ($/year)
| Area |
25‐ |
25‐44 |
45‐64 |
Age 65+ |
| United States |
26,207 |
54,830 |
61,527 |
31,185 |
| Nevada |
38,522 |
57,823 |
61,440 |
36,877 |
| Churchill Co. |
47,454 |
54,340 |
55,408 |
30,317 |
| Carson City |
41,261 |
52,595 |
56,257 |
40,548 |
| Clark Co. |
39,399 |
58,264 |
60,840 |
36,976 |
| Douglas Co. |
45,795 |
65,445 |
74,429 |
46,384 |
| Elko Co. |
38,864 |
63,325 |
73,178 |
30,644 |
| Lyon Co. |
47,065 |
46,855 |
53,137 |
37,547 |
| Nye Co. |
11,903 |
50,240 |
55,134 |
31,457 |
| Washoe Co. |
35,567 |
56,675 |
62,975 |
38,962 |
Sources of Income
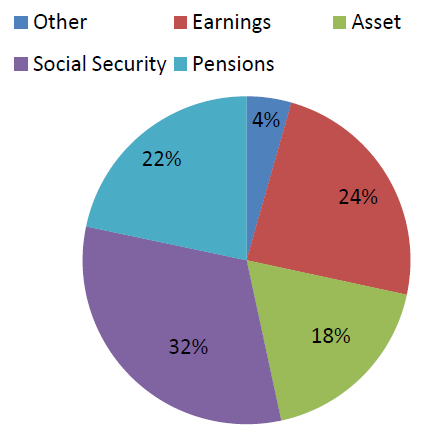
The senior population relies on markedly different sources of income as compared to their younger counterparts. For example, for Nevadans under age 65 more than 90 percent of personal income, on average, is from work earnings, while for Nevadans 65 and older, a little under a quarter of average personal income is from work earnings (see Figure 1). The remainder of personal income for Nevada seniors is from Social Security payments (32 percent), pensions (22 percent), asset income from savings and investments (18 percent) and small amounts of other miscellaneous sources (4 percent).
Figure 1. Sources of Personal Income for Nevadans 65 or Older, 2005‐2007
Data From Figure 1
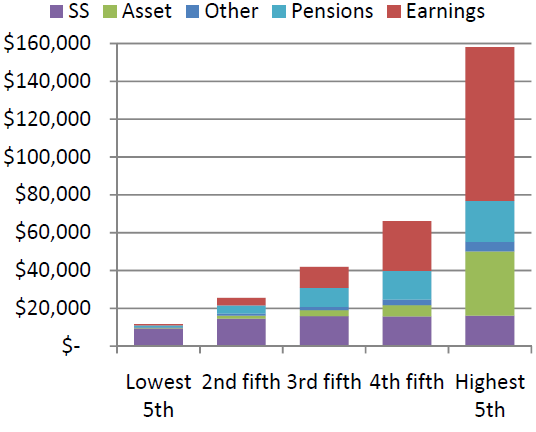
Sources of income also vary over income groups among seniors. Figure 2 shows average household income by its source for five income groups. Household income is total income from all household members, including a younger spouse or children who may still be in the workforce. Nevada seniors in the lowest income group had an average annual income of less than $12,000. On average, over 80 percent of this income was from Social Security. For the middle income group, Social Security payments account for almost 40 percent of total income for senior households while for the highest income group, only 10 percent of income is from Social Security. The higher the income group, the larger the share of income the household received from work earnings. The wealthiest income group received more than 50 percent of their total average earnings of $158,000 from work earnings. The wealthier income groups had a householder with a lower average age. As age increases, reliance on Social Security payments will increase.
Figure 2. Average household income for Nevada senior households, by income group, 2005‐2007
Data From Figure 2
Wealth
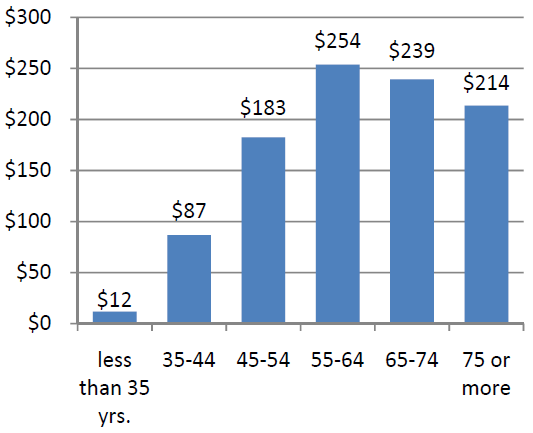
Seniors who own a house or other assets may have greater resources available than is indicated by their income. As seen in Figure 3, average net assets are low for younger age groups and usually reach a peak for the 55 to 64 year old group. In the United States in 2007, median assets of this age group were estimated to be $254,000.
Figure 3. 2007 Median Net Assets by Age Group (Thousands of $)
Data From Figure 3
Source: Federal Reserve Board Survey of Consumer Finances.
Retirement Preparations of Baby Boomers
Of great concern to Nevada policy makers is whether the coming wave of retiring baby boomers is adequately prepared for retirement. A 2004 study by the Congressional Budget Office (CBO) found that in general, the baby boom cohort is better prepared than previous generations, if federal government programs such as Social Security and Medicare continue to be available at current benefit levels. For example, ratios of net assets to income are similar to previous generations (See Table 2). Of course, not all families are equally prepared. The study estimated that about half of baby boomer households were likely to be able to maintain their current lifestyle in retirement. Another quarter of households will be almost entirely dependent on Social Security. Some of these primarily low-income households will nevertheless maintain their current lifestyle if these benefits remain available. Another quarter of baby boomer households are more at risk of not being able to replace current living standards. At the time of the report, CBO analysts found that these households could make up shortfalls in retirement income by increased savings and by delaying retirement a few years.
Last year’s economic downturn may have had a negative effect on all types of households, greatly expanding the number of households at risk for not being able to maintain their current lifestyle during retirement. Federal Reserve Bank economists estimated that the events of 2008 reduced median net worth to 3.2 percent less than the median in 2004. Both housing assets and stock market assets have decreased at the same time that employment opportunities are shrinking.
Table 2. Ratios of Median Family Wealth to Median Income, by Age of Head of Household
| Age Group |
1989 |
1998 |
2007 |
| Age 35 to 44 |
1.5 |
1.5 |
1.5 |
| Age 45 to 54 |
2.4 |
2.1 |
2.8 |
| Age 55 to 64 |
3.5 |
3.3 |
4.6 |
Source: Federal Reserve Board Survey of Consumer Finances and author’s calculations.
Poverty
Nevada seniors have economic characteristics that are distinct from seniors in the other Western states and the United States in general. These differences include, among others, percentage of senior population in poverty and in the labor force.
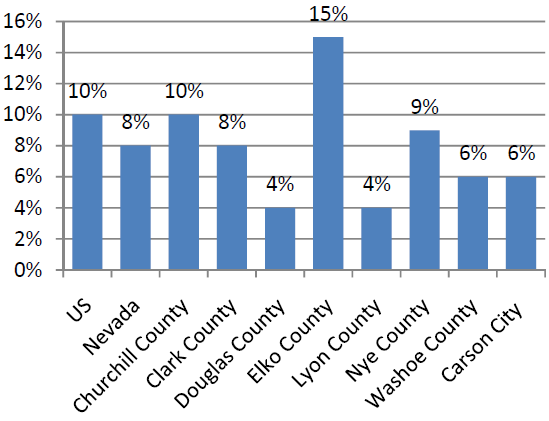
Figure 4. Percentage of Seniors (65 Plus) in Poverty, 2005‐2007
Data From Figure 4
Poverty rates for the population 65 and over are lower in Nevada (8 percent) compared to the rest of the nation (10 percent, see Figure 4). This difference is most pronounced for the female population. The poverty rate among both females and males in Nevada is also lower than the respective levels in Arizona and California. There is, however, a large variation in poverty rates across Nevada. While Douglas and Lyon County seniors have only 4 percent poverty rates, 15 percent of seniors in Elko County live in poverty. The rate of poverty amongst the senior male population in Clark County slightly exceeds the state rate. In contrast, the senior male population in Washoe County has a poverty rate that is lower than Nevada’s. The rate of poverty for female seniors in both Clark and Washoe counties is comparable to Nevada’s level of poverty amongst the same population.
Labor Force Participation
The difference between U.S. and Nevada labor force participation for seniors is also substantial (see Figure 5). The percentage of seniors in the labor force in Nevada exceeds that in the United States by four percentage points. Elko and Washoe counties have larger labor force participation for seniors than the state. In contrast the other counties have lower or similar percentage of seniors in labor force as compared to the state.
Figure 5. Percentage of Seniors (65 Plus) in Labor Force, 2005‐2007
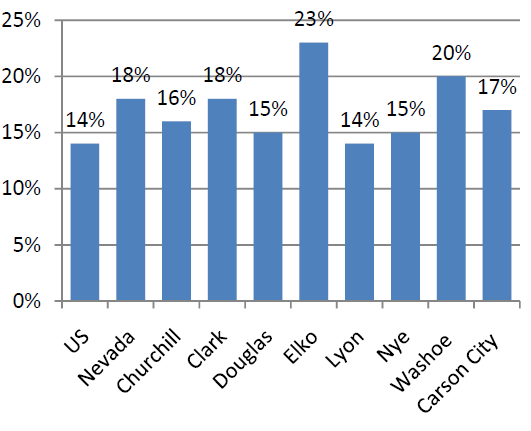
Data From Figure 5
Expenditures
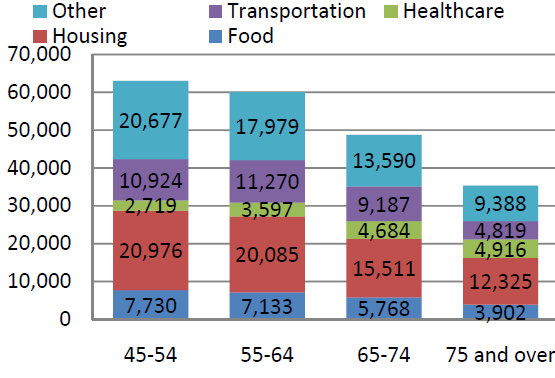
Considerable differences exist in expenditure patterns between different age groups. These differences are especially pronounced for families headed by someone age 65 or older compared to the families headed by someone under 65. With the exception of health care, seniors have lower average expenditures on different product groups (see Figure 6). Housing and food expenditures decrease as age increases from 55 to 64 to 65 and up. Large differences in expenditures also exist between the 65 to 74 and 75 and up age groups. The dynamics of change in the expenditure patterns for these two groups is similar to the overall dynamics of expenditure.
Households with at least one member who is 65 years old or older made up about 17.4 percent of total Nevada households in 2007, or approximately 166,000 households. Using consumer expenditure data from the Consumer Expenditure Survey, a typical senior household was assumed to have disposable income of approximately $39,000 in 2007. Total direct spending by these households is estimated to be about $6.4 billion, with leakages outside of the state equal to $1.6 billion, leaving about $4.8 billion in the state as direct spending. The multiplier effect for elderly households is about 1.5 so that the 6.4 billion in original spending generates a total economic activity of $9.7 billion as it circulates throughout the economy. This economic activity reflects more than 73,000 jobs and $5.2 billion in value added in the state. Elderly households’ spending represents about 8 percent of total GDP activity in Nevada.
Figure 6. Household Expenditure by Age of Reference Person in Western States, 2005‐2006
Data From Figure 6
Source: U.S. Bureau of Labor Statistics, Consumer Expenditure Survey Western States include Alaska, Arizona, California, Colorado, Hawaii, Idaho, Montana, Nevada, New Mexico, Oregon, Utah, Washington, and Wyoming.
Conclusion
Only 51 percent of the senior population in the U.S. is in the 65 to 74 age group. In contrast, 57 percent of Nevada seniors are between the ages 65 and 74. This may be one of the reasons for the higher income levels, lower poverty rate and higher labor force participation of Nevada seniors. Seniors bring a wider variation of income sources to the state. Retirement preparations of the coming baby boom generation of retirees may have been better than is widely acknowledged but the recent downturn in the Nevada economy may have set back these preparations considerably. In conclusion, the Nevada senior population differs from the national average and their expenditure patterns impact the state’s economy differently from other household age groups.
References
American Community Survey, U.S. Census Bureau. 3-Year Public Use Microdata Sample: Nevada, 2005-2007. Available at Census Site. Washington, D. C.: US Census Bureau; 2007. Accessed April 3, 2009.
American Community Survey, U.S. Census Bureau. 3-year estimates, 2005-2007. Available at Census Site. Washington, D.C.: U.S. Census Bureau; 2008. Accessed May 2009.
Congressional Budget Office. The Retirement Prospects of the Baby Boomers. Economic and Budget Issue Brief. Washington, D.C. March 18, 2004.
Bucks, B., A, Kennickell, T. Mach and K. Moore. Changes in U.S. Family Finances from 2004 to 2007: Evidence from the Survey of Consumer Finances. Federal Reserve Bulletin, Vol. 95. Board of Governors of the Federal Reserve System. February 2009.
Kennickell, A. and J. Shack-Marquez. Changes in Family Finances from 1983 to 1989: Evidence from the Survey of Consumer Finances. Federal Reserve Bulletin, Vol. 78. Board of Governors of the Federal Reserve System. January 1992.
U.S. Bureau of Labor Statistics. Consumer Expenditure Survey Table 3850: Consumer Units with Reference Person Age. Available at BLS Site. Washington, D.C.: U.S. Bureau of Labor and Statistics; 2007. Accessed October 15, 2008.
Note: Data is from the Census Bureau’s American Community Survey 3 Year Estimates between 2005 and 2007 except where noted. The authors have added their own calculations and charts to the underlying source data throughout this factsheet. As of this date, estimates are available for counties with population of 20,000 or more so smaller counties are not listed in this factsheet.
Figure 1. Sources of Personal Income for Nevadans 65 or Older, 2005‐2007
| Category |
Percentage |
| Social Security |
32% |
| Earnings |
24% |
| Pensions |
22% |
| Assert |
18% |
| Other |
4% |
Figure 2. Average household income for Nevada senior households, by income group, 2005‐2007
| Category |
Average Household Income |
| Lowest 5th |
~$10,000 |
| 2nd fifth |
~$20,000 |
| 3rd fifth |
~$40,000 |
| 4th fifth |
~$60,000 |
| Highest 5th |
~$160,000 |
Figure 3. 2007 Median Net Assets by Age Group (Thousands of $)
| Age Group |
Median Net Assets |
| less than 35 yrs. |
$12 |
| 35‐44 |
$87 |
| 45‐54 |
$183 |
| 55‐64 |
$254 |
| 65‐74 |
$239 |
| 75 or more |
$214 |
Figure 4. Percentage of Seniors (65 Plus) in Poverty, 2005‐ 2007
| Area |
Percentage |
| US |
10% |
| Nevada |
8% |
| Churchill County |
10% |
| Clark County |
8% |
| Douglas County |
4% |
| Elko County |
15% |
| Lyon County |
4% |
| Nye County |
9% |
| Washoe County |
6% |
| Carson City |
6% |
Figure 5. Percentage of Seniors (65 Plus) in Labor Force, 2005‐2007
| Area |
Percentage |
| US |
14% |
| Nevada |
18% |
| Churchill |
16% |
| Clark |
18% |
| Douglas |
15% |
| Elko |
23% |
| Lyon |
14% |
| Nye |
15% |
| Washoe |
20% |
| Carson City |
17% |
Figure 6. Household Expenditure by Age of Reference Person in Western States, 2005‐2006
| Age of Reference |
Other |
Transportation |
Healthcare |
Housing |
Food |
| 45-54 |
20,677 |
10,924 |
2,719 |
20,976 |
7,730 |
| 55-64 |
17,979 |
11,270 |
3,597 |
20,085 |
7,133 |
| 65-74 |
13,590 |
9,187 |
4,684 |
15,511 |
5,768 |
| 75 and over |
9,388 |
4,819 |
4,916 |
12,325 |
3,902 |
Published by:
Fadali, E., Yolyan, R., and Harris, T., 2009, Economic Indicators for Nevada Elders, Extension | University of Nevada, Reno, FS-09-10
An EEO/AA Institution. Copyright © 2026, University of Nevada Cooperative Extension.
A partnership of Nevada counties; University of Nevada, Reno; and the U.S. Department of Agriculture
