Commuting Patterns in the State of Nevada
Introduction
This extension fact sheet examines place of residence and place of work data from the U.S. Census of Population and Housing. Its purpose is to show inter-state and inter-county commuting patterns within the state of Nevada in an effort to understand local economies and the state’s overall economic structure.
The most commonly used commuting information is “journey to work” data. These data represent flows of people traveling from their place of residence to their place of employment. Journey to work data can be valuable to transportation and community planning. By understanding not only population (place of residence) figures, but also understanding where those residents travel for work; transportation and planning professionals can more effectively measure the economic structure of their community as well as the economic structure of surrounding communities.
Each state in the nation experiences some level of inter-state commuting. Some state residents travel outside the state for work. These people are called outcommuters. Others travel into that same state from other states for work. These workers are called incommuters.
Nevada Inter-State Commuting Patterns
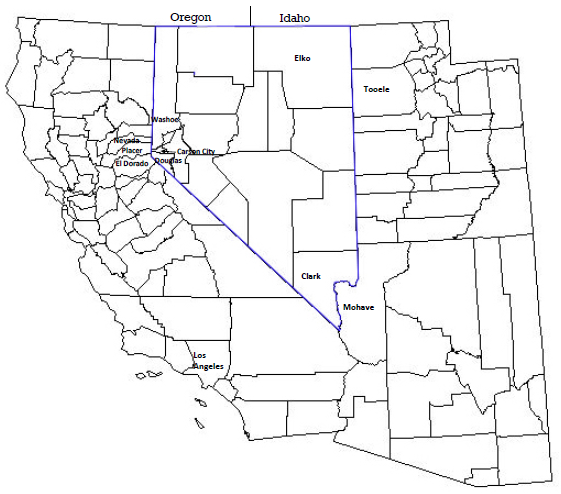
The state of Nevada is somewhat isolated geographically. In 2000, there were approximately 923,000 resident workers in the State of Nevada, and only 14,996 (1.6 percent) of those workers traveled across state borders for work (outcommuters). A large number of these workers commuted from (see Figure 1):
- Clark County, Nevada to Los Angeles County, California and Mohave County, Arizona
- Douglas County, Nevada to El Dorado County, California
- Elko County, Nevada to Tooele County, Utah
- Washoe County, Nevada to Placer County, California and Nevada County, California.
While the state of Nevada saw only 14,996 of its resident workers commute across state borders in 2000, it received over 33,000 incommuters. The largest groups of incommuters came from (see Figure 1):
- Mohave County, Arizona and Los Angeles County, California to Clark County, Nevada
- El Dorado County, California to Douglas County, Nevada and Carson City, Nevada
- Placer County, California and Nevada County, California to Washoe County, Nevada
The data indicate that Nevada realized a net gain of commuters. This is primarily due to the location of Nevada’s major cities
and the location of cities in surrounding states. Las Vegas is near the border of both California and Arizona and Reno is very close to the California border. These are the two largest cities in Nevada, and they attract a large number of workers from neighboring states. In fact, over 25,000 of the 33,431 inter-state incommuters traveled to Clark County or Washoe County. Also, a large portion of the economic activity in the Lake Tahoe area occurs on the Nevada side, attracting over 4,000 workers from neighboring El Dorado County, California. All totaled, these three counties accounted for just over 30,000 of Nevada’s 33,431 inter-state incommuters.
Figure 1. Nevada’s Inter‐State Commuting Patterns
Conversely, there are very few large cities in neighboring states within a short distance of Nevada’s state border. This keeps most of the working population within state borders simply because of the lack of economic activity along the border in neighboring states. Of the 14,996 interstate outcommuters, over 11,500 of those came from Clark and Washoe counties, with another 1,500 coming from Douglas County. Table 1 illustrates the incommuting and outcommuting totals for Nevada and its neighboring states.
Table 1. Nevada’s Inter‐State Commuters
| States |
Outcommuters (traveling to) |
Incommuters (traveling from) |
| California |
7,126 |
13,478 |
| Arizona |
2,191 |
12,701 |
| Utah |
819 |
2,046 |
| Idaho |
133 |
819 |
| Other |
4,727 |
4,387 |
| Total |
14,996 |
33,431 |
Nevada’s Commuting Patterns
Outcommuting:
While only 14,996 (1.6 percent) of Nevada workers traveled across state lines for work, there are another 33,377 (3.6 percent) workers who traveled to another county within Nevada for their employment. While this aggregate rate is rather low, it is misleading because of the extremely low outcommuting rate in Nevada’s most populated county, Clark County. In reality, thirteen of Nevada’s seventeen counties experienced outcommuting rates of at least 10 percent with six of those counties having outcommuting rates higher than 25 percent. Storey County had the highest percentage of outcommuters in the state with 80.7 percent of their resident workers commuting to other counties while Clark County had the lowest rate at 1.7 percent.
Tables 2 and 3 illustrate counties with the highest and lowest rates of outcommuting.
Table 2. Nevada Counties with Highest Percent Outcommuters
| County |
Percent |
Outcommuters |
| Storey |
80.7% |
1,409 |
| Lyon |
48.1% |
7,275 |
| Douglas |
34.3% |
6,498 |
| Esmerelda |
29.6% |
127 |
| Pershing |
25.6% |
573 |
Table 3. Nevada Counties with Lowest Percent Outcommuters
| County |
Percent |
Outcommuters |
| Clark |
1.7% |
10,736 |
| Washoe |
4.3% |
7,336 |
| Humboldt |
6.2% |
427 |
| White Pine |
7.6% |
250 |
| Lincoln |
10.3% |
150 |
The counties with the highest outcommuting rates are small to medium sized counties that are near a metropolitan county or Carson City. The top three outcommuting counties, Storey, Lyon and Douglas, all border Washoe County, Carson City, or both. The data also indicate that counties with the lowest percentage of outcommuters were the two metropolitan counties (Washoe and Clark) and Humboldt, White Pine, and Lincoln Counties, three of the more geographically isolated counties in Nevada.
Incommuting:
As Table 1 illustrates, the state of Nevada attracted over twice as many workers from other states as it saw leave the state for work. The overwhelming majority of these inter-state commuters traveled to Clark, Washoe, and Douglas Counties. Surprisingly, these counties did not lead the list when looking at total percentage of a county’s workforce incommuting. This is because of the inter-county commuting that takes place within the state, as well as the large amounts of local jobs in these metropolitan markets. The number of incommuters into these metropolitan counties was simply a small proportion of the total job market. So similar to what was found in outcommuting; the counties with the lowest percentage of their county workforce incommuting for work were Clark and Washoe Counties, Elko County, which is the most populated county in eastern Nevada, and White Pine and Mineral Counties, two geographically isolated counties.
Several small to medium-sized counties, most of which have strong employment advantages, showed the largest proportion of their workforce incommuting from another county. For example, both Eureka County and Carson City have a competitive advantage in employment because of the strong mining industry in Eureka County and the availability of government jobs in Carson City. Tables 4 and 5 illustrate those Nevada counties with the highest and lowest percentage of incommuters.
Table 4. Nevada Counties with Highest Percentage of Incommuters
| County |
Percent |
Incommuters |
| Eureka |
71.9% |
1,613 |
| Storey |
51.1% |
351 |
| Carson City |
37.6% |
10,624 |
| Douglas |
36.4% |
7,117 |
| Lyon |
22.4% |
2,276 |
Table 5. Nevada Counties with Lowest Percentage of Incommuters
| County |
Percent |
Incommuters |
| Clark |
3.7% |
23,766 |
| |
6.2% |
199 |
| Mineral |
7.7% |
150 |
| Washoe |
7.9% |
13,994 |
| Elko |
8.9% |
1,840 |
Economic Development Considerations
State and county economic development practitioners need to be aware of commuting flows. While economic development practitioners can strive to help Nevada’s counties and communities become more “self-sufficient” by attracting jobs which meet the employment demands of local residents, they must cooperate regionally to create jobs. Benefits from employment tend to be regional, but state and county decision makers must be aware of employment commuting impacts and how these impacts affect county economies. Commuting impacts, such as where commuters shop, the expense of commuting, the loss of community sense of place and well-being due to commuting, and the environmental and energy impacts of commuting, are questions that should be investigated.
References
- U.S. Bureau of Census. County-to-County Worker Flow Files, 2000. Prepared by the Population Division, Journey to Work and Migration Statistics Branch, Bureau of the Census, Washington, DC: Internet Release, March 6, 2003
Published by:
Sendall, B., Harris, T., and Singletary, L., 2008, Commuting Patterns in the State of Nevada, Extension | University of Nevada, Reno, FS-08-34
An EEO/AA Institution. Copyright © 2026, University of Nevada Cooperative Extension.
A partnership of Nevada counties; University of Nevada, Reno; and the U.S. Department of Agriculture
