Trends in Nonemployer Statistics in Nevada (2005)
Introduction
In 2005, 7.5 million firms had employees and another 20.4 million firms had no employees across the nation. A nonemployer business is defined as a business that has no paid employees, has annual business receipts of $1,000 or more ($1 or more in construction industries) and is subject to federal income tax. Nonemployer businesses are generally small, such as real estate agents and independent contractors. They constitute nearly 75 percent of all businesses, but they contribute only about 3 percent of overall sales and receipts data. Generally, an establishment is a single physical location at which business is conducted or services or industrial operations are performed. However, for nonemployers, each distinct business income tax return filed by a nonemployer business is counted as an establishment. Nonemployer businesses may operate from a home address or a separate physical location. Despite the large presence of nonemployer businesses in the economy, little research has been done to examine the trends of these businesses.
As shown in Table 1, from 1997 through 2005, Nevada had the highest growth rate of nonemployer establishments with an increase of 74.4 percent. Overall, western states experienced a higher growth rate (33.2 percent) in nonemployer establishments than the nation (32.1 percent), despite Alaska having the lowest growth rate in the nation.
Table 1. Nonemployer Establishment Growth in Western United States, 1997 to 2005
| State |
1997 |
2005 |
Change |
Percentage Change |
Rank |
| Nevada |
93,777 |
163,512 |
69,735 |
74.4% |
1 |
| Arizona |
240,925 |
358,145 |
117,220 |
48.6% |
4 |
| Utah |
126,190 |
175,121 |
48,931 |
38.8% |
7 |
| California |
1,936,556 |
2,609,258 |
672,702 |
34.7% |
11 |
| Idaho |
79,240 |
106,257 |
27,017 |
34.1% |
14 |
| Colorado |
303,196 |
401,092 |
97,896 |
32.3% |
17 |
| Hawaii |
70,203 |
87,717 |
17,514 |
25.0% |
27 |
| Washington |
315,367 |
386,895 |
71,528 |
22.7% |
32 |
| Wyoming |
34,179 |
41,861 |
7,682 |
22.5% |
33 |
| Montana |
67,187 |
80,851 |
13,664 |
20.3% |
38 |
| New Mexico |
96,964 |
116,614 |
19,650 |
20.3% |
40 |
| Oregon |
209,846 |
246,129 |
36,283 |
17.3% |
46 |
| Alaska |
48,964 |
50,928 |
1,964 |
4.0% |
51 |
| Western States |
3,622,594 |
4,824,380 |
1,201,786 |
33.2% |
|
| United States |
15,439,609 |
20,392,068 |
4,952,459 |
32.1% |
|
Source: U.S. Department of Commerce. Nonemployer Statistics. U.S. Census Bureau, Economic Planning and Coordination Division, Register Analysis Branch, 1997 and 2005.
Table 2. Establishment Shares by Firm Size 2005
| Area Name |
Total Establishments |
Firms with 1-4 Employees |
Firms with 5-9 Employees |
Firms with 10 or More Employees |
Nonemployer Firms |
| Churchill |
1,838 |
14.1% |
6.7% |
7.8% |
71.4% |
| Clark |
151,057 |
13.6% |
4.4% |
7.3% |
74.7% |
| Douglas |
6,914 |
15.2% |
4.1% |
4.7% |
76.0% |
| Elko |
3,290 |
16.8% |
6.3% |
8.2% |
68.7% |
| Esmeralda |
83 |
13.3% |
3.6% |
3.6% |
79.5% |
| Eureka |
153 |
12.4% |
5.9% |
2.0% |
79.7% |
| Humboldt |
1,154 |
17.1% |
6.8% |
8.8% |
67.4% |
| Lander |
330 |
16.7% |
3.6% |
6.7% |
73.0% |
| Lincoln |
337 |
13.9% |
6.8% |
5.3% |
73.9% |
| Lyon |
3,368 |
11.2% |
3.7% |
5.1% |
80.0% |
| Mineral |
345 |
12.8% |
4.3% |
4.3% |
78.6% |
| Nye |
3,236 |
12.6% |
4.0% |
5.5% |
77.8% |
| Pershing |
326 |
17.2% |
4.3% |
5.8% |
72.7% |
| Storey |
274 |
21.9% |
3.6% |
3.6% |
70.8% |
| Washoe |
39,787 |
16.4% |
5.6% |
8.5% |
69.6% |
| White Pine |
737 |
15.5% |
6.6% |
6.5% |
71.4% |
| Carson City |
8,704 |
16.7% |
4.8% |
6.4% |
72.1% |
| Nevada |
222,073 |
14.4% |
4.7% |
7.3% |
73.6% |
Source: U.S. Department of Commerce. Nonemployer Statistics. U.S. Census Bureau, Economic Planning and Coordination Division, Register Analysis Branch, 2005. U.S. Department of Commerce. County Business Patterns. U.S. Census Bureau, Economic Planning and Coordination Division, Register Analysis Branch, 2005.
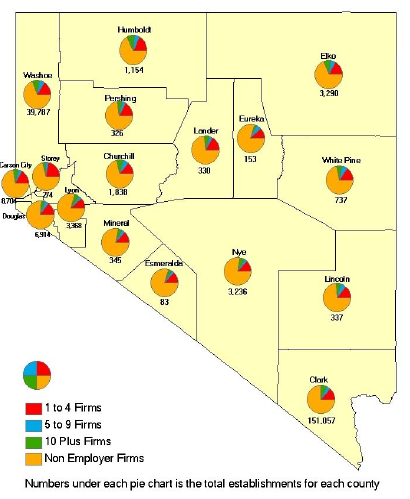
Establishments
Table 2 shows the establishment shares by firm size in 2005 for each county in Nevada as well as the state overall. In 2005, Nonemployer firms comprised between 67.4 percent and 80 percent of all establishments in the Nevada counties. Lyon County had the greatest percentage of establishments having no employees, and 2,694 (80 percent) nonemployer firms. Humboldt County had the smallest percentage of nonemployer firms with 778 (67.4 percent) establishments having no employees.
Humboldt County had the greatest percentage of large establishments, with 8.8 percent of its firms having 10 employees or more. Eureka County had the lowest percentage of large firms, with just 2 percent of its firms having 10 or more employees.
Table 3. Employee Shares by Firm Size
| Area Name |
Total Employees |
Firms with 1-4 Employees |
Firms with 5-9 Employees |
Firms with 10 or more Employees |
Nonemployer Firms |
| Churchill |
7,165 |
8.3% |
11.0% |
62.4% |
18.3% |
| Clark |
899,910 |
6.0% |
5.4% |
76.1% |
12.5% |
| Douglas |
24,976 |
10.9% |
8.2% |
59.9% |
21.0% |
| Elko |
18,914 |
7.2% |
7.6% |
73.2% |
12.0% |
| Esmeralda |
178 |
15.7% |
11.8% |
36.0% |
37.1% |
| Eureka |
679 |
7.6% |
10.1% |
64.4% |
18.0% |
| Humboldt |
6,258 |
6.5% |
7.2% |
73.9% |
12.4% |
| Lander |
1,034 |
11.7% |
7.2% |
57.8% |
23.3% |
| Lincoln |
836 |
12.1% |
16.6% |
41.4% |
29.8% |
| Lyon |
12,554 |
6.7% |
6.1% |
65.7% |
21.5% |
| Mineral |
1,534 |
6.9% |
6.6% |
68.8% |
17.7% |
| Nye |
10,818 |
8.5% |
7.5% |
60.7% |
23.3% |
| Pershing |
1,484 |
9.1% |
6.4% |
68.6% |
16.0% |
| Storey |
639 |
23.5% |
11.0% |
35.2% |
30.4% |
| Washoe |
219,602 |
7.0% |
6.6% |
73.8% |
12.6% |
| White Pine |
2,613 |
9.3% |
11.2% |
59.3% |
20.1% |
| Carson City |
32,010 |
9.9% |
7.9% |
62.6% |
19.6% |
| Nevada |
1,252,934 |
6.5% |
5.9% |
74.6% |
13.1% |
Source: U.S. Department of Commerce. Nonemployer Statistics. U.S. Census Bureau, Economic Planning and Coordination Division, Register Analysis Branch, 2005. U.S. Department of Commerce. County Business Patterns. U.S. Census Bureau, Economic Planning and Coordination Division, Register Analysis Branch, 2005.
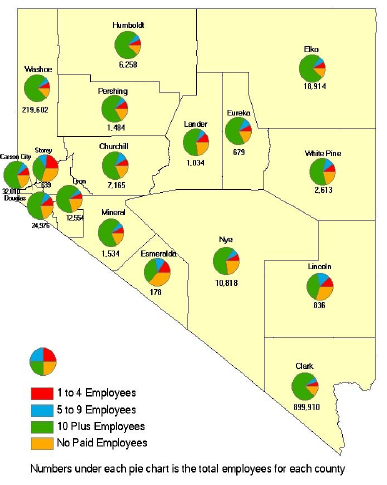
Employees
Table 3 examines the employee shares by firm size. Each nonemployer firm was assigned one employee to represent the business owner. For all but one county the majority of employees work in firms with 10 employees or more. Esmeralda County is the lone exception, with 37.1 percent of individuals working in nonemployer firms versus 36 percent of its employees working in firms of 10 or more employees. Clark County has the highest percentage of employees (76.1 percent) working in large firms, while Storey County has the lowest percentage of workers (35.2 percent) employed by firms of 10 or more employees.
In 11 counties in 2005, there were more nonemployer firms than employees working in establishments with less than 10 employees. Esmeralda County had the greatest percentage of individuals in nonemployer firms (37.1 percent), while Elko County had the lowest percentage of workers (12.0 percent) in nonemployer firms.
Nonemployer Statistics by Industry
Table 4 depicts the growth in nonemployer establishments by industry in the state of Nevada from 2003 to 2005. In 2005, more than one-third of all nonemployer firms were in the Real Estate and Rental and Leasing Sector and the Professional, Scientific and Technical Services Sector, accounting for more than 43 percent of total receipts.
Overall, Nevada experienced a 14.6-percent growth in nonemployer establishments from 2003 to 2005. All sectors had some positive growth during this period. The sector experiencing the highest growth in establishments was the Real Estate and Rental and Leasing Sector with a 31-percent increase.
The sector with the smallest establishment growth rate over this period was the Manufacturing Sector, which experienced just a 0.5-percent increase.
The changes in nonemployer receipts by industry are also shown in Table 4. In Nevada, each sector experienced higher nonemployer receipts in 2005 than 2003. Overall, Nevada nonemployer receipts increased by 22.1 percent over the 2-year period. The Utilities Sector had the highest growth rate with a 44.8-percent increase in total receipts. The Accommodation and Food Service Sector had the lowest growth rate in total receipts for nonemployer firms, experiencing a modest 4.9-percent increase.
Table 4. Nevada Nonemployment Statistics by NAICS Sector, 2003-2005
| NAICS Sector |
2003 Nonemployer Establishments Number |
2003 Receipts($1000) |
2005 Nonemployer Establishments Number |
2005 Receipts($1000) |
Percent Change 2003-2005 Number |
2003-2005 Receipts |
| Forestry and Ag Services |
647 |
23,162 |
686 |
26,418 |
6.0% |
14.1% |
| Mining |
333 |
16,596 |
380 |
23,539 |
14.1% |
41.8% |
| Utilities |
67 |
3,738 |
86 |
5,411 |
28.4% |
44.8% |
| Construction |
9,467 |
615,803 |
10,785 |
734,285 |
13.9% |
19.2% |
| Manufacturing |
1,949 |
127,164 |
1,959 |
140,249 |
0.5% |
10.3% |
| Wholesale trade |
3,130 |
295,004 |
3,215 |
316,232 |
2.7% |
7.2% |
| Retail trade |
13,994 |
691,641 |
14,877 |
744,543 |
6.3% |
7.6% |
| Transportation and Warehousing |
4,403 |
263,307 |
5,179 |
352,073 |
17.6% |
33.7% |
| Information |
2,555 |
139,179 |
2,920 |
179,018 |
14.3% |
28.6% |
| Finance and Insurance |
9,132 |
678,716 |
10,549 |
762,591 |
15.5% |
12.4% |
| Real Estate and Rental and Leasing |
24,288 |
1,989,118 |
31,810 |
2,739,518 |
31.0% |
37.7% |
| Professional, Scientific and Technical Services |
22,190 |
1,239,623 |
24,179 |
1,475,139 |
9.0% |
19.0% |
| Administrative and Waste Management |
8,753 |
311,679 |
9,686 |
370,271 |
10.7% |
18.8% |
| Educational Services |
1,840 |
38,839 |
2,321 |
46,725 |
26.1% |
20.3% |
| Health Care and Social Assistance |
8,146 |
371,113 |
9,144 |
417,032 |
12.3% |
12.4% |
| Arts, Entertainment and Recreation |
10,383 |
493,809 |
12,001 |
600,344 |
15.6% |
21.6% |
| Accommodation and Food Service |
1,789 |
128,302 |
1,997 |
134,556 |
11.6% |
4.9% |
| Other Services |
19,663 |
583,563 |
21,738 |
710,731 |
10.6% |
21.8% |
| Total |
142,729 |
8,010,356 |
163,512 |
9,778,675 |
14.6% |
22.1% |
Source: U.S. Department of Commerce. Nonemployer Statistics. U.S. Census Bureau, Economic Planning and Coordination Division, Register Analysis Branch, 2005.
Conclusion
Nonemployer firms comprise nearly 75 percent of all businesses in Nevada. From 1997 to 2005, Nevada experienced a 74.4-percent increase in nonemployer establishments, outpacing the national growth rate by more than 42 percent. Additionally in 2005, nonemployer firms outnumbered all individuals working in firms with less than 10 employees. Considering this information, it is important to further examine the impacts of rural nonemployer establishments in Nevada and the western United States.
Published by:
Price, S. and Harris, T., 2008, Trends in Nonemployer Statistics in Nevada (2005), Extension | University of Nevada, Reno, FS-08-13
An EEO/AA Institution. Copyright © 2026, University of Nevada Cooperative Extension.
A partnership of Nevada counties; University of Nevada, Reno; and the U.S. Department of Agriculture
