Economic Development 2002 Eureka County Agricultural Statistics
Eureka County Nevada is known for its historical “BOOM or BUST” economy. Indeed, the county’s residents have experienced many good and bad years since gold was discovered here in the 1860’s. This is attributed to the reality that there are few economic business sectors within the county to support its tax base. However, the agricultural sector of Eureka County is a sector that has historically maintained its economic viability. Currently the only economic sector that produces more than agriculture is the mining sector. This fact sheet is designed to provide an overview of important statistics relating to Eureka County and its agricultural sector.
Eureka ranks sixteenth of seventeen counties in terms of population, currently estimated at 1,930. The county encompasses 4,182 square miles or 2,676,718 acres of land of which 82 percent is administered by the federal government. These federally administered lands, contribute significantly to the agricultural sector as they provide seasonal grazing for resident livestock herds. Privately owned land in farms comprises 8 percent of land area in Eureka County. The 1997 Census of Agriculture, the most recent census, reported that there were 84 farms and ranches within the county encompassing 214,966 acres for an average size of 2,559 acres, (Table 1).
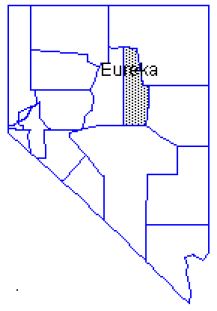
Eureka County, in the heart of the Great Basin, has a rugged terrain. Fertile, high desert valleys are surrounded by steep mountains. Key areas of agricultural production include Diamond Valley in the southern part of the county, Pine Valley in the central part of the county and Boulder and Crescent Valley in the northern part of the county.
Table 1. Eureka County Demographics, Area and Agricultural Data
| Category |
Amount |
| Population |
1,930 |
| Size |
2,676,718 acres or 4,182 square miles |
| Number of Farms and Ranches |
84 |
| Land in Farms |
214,966 acres |
| Average size |
2,559 acres |
| Cropland |
41,125 acres |
| Irrigated Farm Land |
48,530 acres |
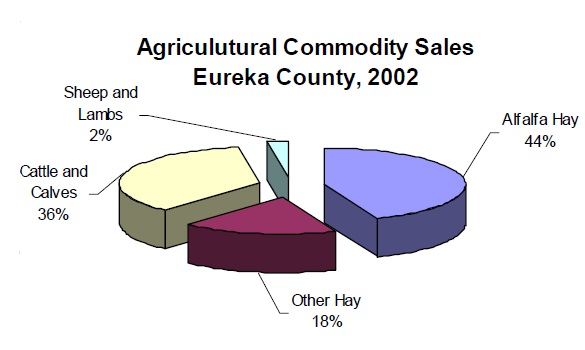
Figure 1 and Table 2 provide an overview of Eureka County’s agricultural sector for the 2002 production period. Alfalfa hay, Nevada’s leading crop, is also Eureka’s leading agricultural crop. Alfalfa hay is produced on 16,000 acres in the county with an average per acre tonnage of 4.7. The 75,200 tons annually produced are marketed as high quality dairy and export grade hay. During 2002, alfalfa hay comprised $7,745,600 or 44 percent of the county’s total agricultural sales.
Cattle and calves ranked as the county’s second largest contributor with $6,360,992 or 36 percent of the county’s agricultural sales. Current statistics show the January 1, 2002 cattle and calf inventory for Eureka County at 22,000.
Ranking third in commodity sales is other hay with a value of $3,108,000, or 18 percent of total agricultural sales. This sector of hay includes native hay, grain hay, and improved grasses. Production covers approximately 10,000 acres at a rate of 2.8 tons per acre. Note that this is the average over all other hays. Cool season grass hay, although a major contributor to this sector, is not reported as a separate hay enterprise, nor are data for this enterprise gathered and reported separately.
The last major agricultural enterprise is the sheep and lamb industry. This enterprise makes up 2% or $422,760 of total agricultural sales. Current data report the January 1, 2002 inventory at 13,000 head of sheep and lambs.
Figure 1.
Data From Figure 1
Table 2. Sales by Commodity
| Hay type |
Amount |
| Alfalfa Hay |
$7,745,600 |
| Other Hay |
$3,108,000 |
| Total Hay |
$10,853,600 |
| Livestock type |
Amount |
| Cattle and Calves |
$6,360,992 |
| Sheep and Lambs |
$422,760 |
| Total Livestock |
$6,783,752 |
| All Hay and Livestock |
$17,637,352 |
Information to compile this fact sheet was attained from the 2002-2003 Nevada Agricultural Statistics Service’s Annual Report and the 1997 Census of Agriculture. Data is collected in the spring and published in the fall following the production period. Thus the one year lag timeframe. These agencies appreciate the support of Eureka County producers that provide survey information. Questions regarding statistics used in this fact sheet should be directed to the Authors.
Data from figure 1
| Commodity |
Sales in percentages |
| Sheep and Lambs |
2% |
| Other Hay |
8% |
| Cattle and Calves |
36% |
| Alfalfa Hay |
44% |
Published by:
Owens, M. and Riggs, W., 2002, Economic Development 2002 Eureka County Agricultural Statistics, Extension | University of Nevada, Reno, FS-03-62
An EEO/AA Institution. Copyright © 2026, University of Nevada Cooperative Extension.
A partnership of Nevada counties; University of Nevada, Reno; and the U.S. Department of Agriculture
