This publication presents sample costs and returns to produce fall vegetables on small acreages in Nevada. It is intended to be a guide, used to make production decisions, determine potential returns and prepare business and marketing plans. Practices described are based on the production practices considered typical for this crop and region, but may not apply to every situation. A “Your Farm” column in Table 1 is provided for your use.
Table 1: Field Produce Production Costs and Returns, 5000 sq. ft., 2012
Assumptions
The following assumptions refer to Tables 1-4, and reflect the typical costs and returns to establish and produce fall vegetables, those that are planted or harvested during August through November, as part of a three- season production practice using sprinkler irrigation in Nevada. The practices described are not the recommendations of the University of Nevada Cooperative Extension, but rather the production practices and materials considered typical of a well-managed small acreage operation in the region, as determined by the best available research. Costs, materials and practices are not applicable to all situations, as establishment and cultural practices vary among growers within the region.
Production Cultural Practices and Material Inputs
Land
The cultivated area is located on one-fifth of a 1-acre plot having either established agricultural water rights or a water lease. The remainder of the 1-acre plot is devoted to spring and summer crops. The plot is positioned near the producer’s home to facilitate daily visits. The 8,712 square feet has 5,000 square feet of cultivated area for market crop production and 3,712 square feet used for row access. The one-fifth acre is comprised of 50 2-by-50 foot rows with access rows that are approximately 1.5 feet wide. The land market value in 2012 was approximately $21,000 per acre for small land parcels with water rights.
Land Preparation
Two yards of high-quality compost, created on-site from recycled inputs such as unusable produce and free manure, is cultivated in yearly for soil conditioning to the whole 1 acre using a rototiller. Cost for the compost includes the cost of labor to make it and apply it. The compost for the one-fifth acre utilized for fall vegetable production incurred a cost of $36.
Irrigation
The irrigation system consists of 30 hand lines for the entire acre. Material costs for the system, lines, sprinkler heads and other necessary parts are $7000 per acre. Total costs for the one-fifth acre of fall vegetables are $1400. Irrigation through the sprinkler system begins in June and ends the middle of October. Irrigation occurs daily, and sometimes twice a day during the summer.
Crop Selection
The crops represented in this publication were chosen because of their desirability to customers including chefs, CSA participants and co-op shoppers. A large selection of crops was deemed preferable to a single crop or monoculture. Further information about the profitability of the chosen crops will be seen in the ‘discussion’ section preceding the spreadsheets. Any crops being considered for small-scale production should be those that cannot be obtained at the local grocery store, either because of variety, availability, quality or any combination thereof. Varieties were chosen for their qualities in flavor and texture.
Planting
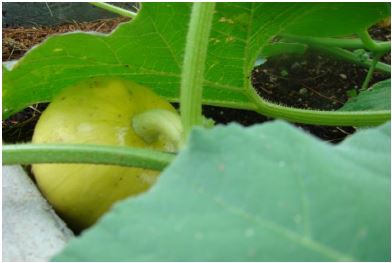
The crops that are grown from seed are mostly planted in August and September with some crops such as radishes and lettuce being planted on an ongoing basis through October. The exceptions are potato seed pieces or ‘eyes’ that are planted in April and garlic which is planted the previous October. The 50 rows consist of three rows each of broccoli, radishes and peas; one row of turnips; two rows each of butternut squash, acorn squash and pumpkins; three rows of mixed variety loose-leaf lettuce; eight rows of garlic and 23 rows of potatoes. Each row is 2 feet wide by 50 feet long for a total of 100 square feet. One package of seed is estimated to plant one row at a cost of $15 per package. These are large packages; for example, the turnip seed package contains 1000 seeds. Five pounds of garlic is planted per row at a cost of $7 per pound. Ten pounds of seed potatoes are planted per row at a cost of $1.50 per pound.
Seasonal Protection
Fabric row covers placed over the plants are used as an extra layer of protection in the fall. Row cover hoops can be made by the producer to reduce input costs. The row covers are used for both fall and spring crops, so the costs are split between the two seasons. The cost for the row cover hoop materials was $45 with an additional cost of $100 for the fabric; total costs for protection for the fall season are $72.50.
Pest Management
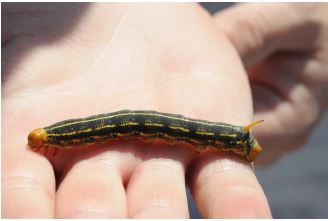
The isolated desert environment typically decreases disease and insect infestations. Utilizing natural control methods reduces input costs. Using row covers also assists with some infestation issues.
Insects
Diatomaceous earth and neem oil were used as needed to control insect populations.
Weeds
Consumers prefer chemical-free production. Therefore, weed control is by hand weeding or use of the rototiller constantly during the season with an average use of 10 labor hours per week. These costs are included in labor calculations.
Labor
The owner/operator cost of labor is based on a monthly wage of $2000. In addition to the owner/operator, labor is provided by an adult family member at a monthly wage of $750 and minor children who are paid $5 per hour. Labor costs include planning, ground preparation, planting, maintenance and weeding, harvesting, packaging and delivery.
Harvest
Potato harvest starts in late July for ‘baby’ size potatoes and continues through November for regular size potatoes. A PTO potato digger attached to the 48 horsepower tractor is used for harvesting. Cost for the attachment is included with implements. In late July and August, the garlic that was planted the previous year is harvested. Radishes begin to be harvested in August, lettuce in September; both continue to be harvested through the fall season. Broccoli, peas, turnips and the squashes are harvested in October or November.
Yield
Potatoes yielded approximately 1 pound per square foot. Garlic yielded nine bulbs per square foot. Broccoli, radishes and peas yielded between one-fifth and one-fourth of a pound per square foot. Turnips yielded 0.69 pounds per square foot, and loose-leaf lettuce had yields of 0.66 pounds per square foot. Yields for members of the cucurbit genus were one butternut squash for every 4 square feet, one acorn squash for every 2.7 square feet and one pumpkin for every 2 square feet. Yield numbers are calculated to allow for loss from pests and weather issues.
Packaging
All vegetables are field packed into boxes at a cost of $1 per box.
Marketing
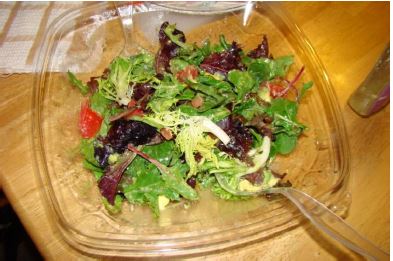
Fall harvested crops are sold to high-end urban chefs, CSA participants and co-op shoppers. Local farmers' markets have closed for the season by October. Advertising includes costs for a website and signage.
Transportation to Market
During the fall, produce is delivered to the urban chefs, the co-op and CSA customers using a sport utility vehicle. Travel costs are included in the fuel and lube portion of the budget.
Returns
Returns are based on market prices received from co-op sales and sales to chefs in urban areas. Returns can vary with EXTREME fluctuation both during the growing season and from year to year as well as differing by location due to market conditions. For this reason, risk analysis along with market analysis should be a consideration of any planting decisions. In this publication, returns per square foot are based on cultivated area. The combination of crops for the season had to produce revenue of $3.07 per square foot of cultivated area of revenue to break even.
Overhead and Capital Recovery Costs
Cash Overhead
Cash overhead consists of various cash expenses paid during the year. These costs include property taxes, interest, office expenses, liability and property insurance and investment/machinery repairs. A complete listing of farm investments and associated costs can be found in Table 2.
Table 2: Investment Summary for Field Produce Production
*table here
Insurance
Insurance on-farm investments vary, depending on the assets included and the amount of coverage. A business owner’s policy provides coverage for property loss, liability insurance, vandalism and coverage for property damage accidents on the farm at a minimum annual cost of $500 for a cost of $125 for the fall season.
Fuel and Lube
The fuel and lube for each piece of equipment is calculated at 20 percent of the average asset value.
Investment Repairs
Annual repairs on all farm investments or capital recovery items that require maintenance are calculated at 2 percent of the average asset value.
Average Asset Value Computation:
(Purchase Price + Salvage Value divided by 2)
Office and Travel
Office and travel costs are estimated at $400 for an average year. These expenses include office supplies, telephone service, Internet service and travel expenses to educational seminars.
Pro-rated Expenses
Insurance, fuel and lube, maintenance, utilities, and office and travel expenses, have all been pro-rated to reflect the amount of time and land occupied by fall season production.
Capital Recovery
Capital recovery costs are the annual depreciation (opportunity cost) of all farm investments. Capital recovery costs are calculated using straight line depreciation. Farm equipment may be purchased new or used, depending on producer preferences. The cost of land payments is not included in these calculations.
Straight Line Depreciation Computation:
(Purchase Price - Salvage Value divided by Useful Life)
Salvage Value
Salvage value is 10 percent of the new purchase price, which is an estimate of the remaining value of an investment at the end of its useful life. The salvage value for land is the purchase price, as land does not normally depreciate.
Table 3: Monthly Cash Flow
*table 3
Discussion
For a three-season small acreage local producer selling to a niche market, the objective is to create relationships with their customer base in addition to hopefully breaking even. This may not mean producing crops with the highest per square foot value during all seasons of the year. The additional example of calculations for monoculture vegetable production (Table 4) of higher return crops (garlic) could possibly pay costs and show profit if selected rather than incurring the small loss shown by the current mix. However, producers who choose to operate on this scale make a conscious decision to plant products that include a variety of healthy food choices for their customers, increasing satisfaction for both their customers and themselves. By choosing to plant numerous crops rather than a monoculture crop, it provides healthy rotations for soil, disease and pest management and increases the options for their customers. The small losses incurred during the fall season are recouped during the spring and summer seasons.
All rights reserved. No part of this publication may be reproduced, modified, published, transmitted, used, displayed, stored in a retrieval system, or transmitted in any form or by any means electronic, mechanical, photocopy, recording or otherwise without the prior written permission of the publisher and authoring agency.
Table 4: Field Produce Production Costs and Returns, 5000 sq ft. all Planted to Garlic
*table here
References
- Bishop, Carol, Holly Gatzke and Kynda Curtis (2010). Small Farm Hoop House Production of Vegetables in Desert Climates Costs & Returns, 2010. University of Nevada Cooperative Extension Special Publication 10-11.
- Kratsch, Heidi, Leslie Allen and Wendy Hanson Mazet. (2010). Getting Started with a Vegetable Garden. University of Nevada Cooperative Extension Fact Sheet 10-15.
- Painter, Kathleen (2011). The Costs of Owning and Operating Farm Machinery in the Pacific Northwest 2011. A Pacific Northwest Publication #346. University of Idaho, Washington State University, and Oregon State University.
- Ward, Ruby, Dan Drost, and A. Whyte. (2011) Assessing Profitability of Selected Specialty Crops Grown In High Tunnels. Journal of Agribusiness. 29(Spring 2011):41-58.
