The Grazing Response Index (GRI) (Reed et al. 1999; Swanson et al. 2019) combines several components of a grazing strategy, frequency of defoliation (how often preferred plants are likely to be bitten while growing), intensity of use (utilization), and opportunity for growth or regrowth. The GRI can be very useful as a grazing management monitoring interpretation and planning tool. Before implementing grazing management, GRI can be used to predict or plan to avoid plant stresses from a planned schedule of grazing. After grazing management, GRI scores can be used to help interpret multiple data sources, such as actual use records, notes about utilization or residual vegetation, and the time of the growing season (phenological stage) when grazing occurred. All these influence growth and regrowth this year and next.
Scoring GRI
The best time to estimate a GRI score is when moving livestock from one use area to the next, or when observing that livestock have moved on their own or that the plants have stopped growing in a particular use area or plant community. To make notes or score GRI, it will help to have the use areas and their important plant communities (see stratification in Swanson et al. 2018) mapped, named and listed in the tables in this publication. Copy or print tables as needed.
Frequency
The frequency component of GRI is based on the number of bites probably taken from preferred forage plants while growing and regrowing. The duration of the grazing period during the growing season is divided by the time needed for sufficient plant growth to stimulate regrazing. The growing season is divided into three phases, slow growth, fast growth and slow growth. The number of grazing days during slow growth is divided by up to 10, and the number of fast growth grazing days is divided by seven to count the bites on preferred forage plants.
Up to one bite is scored as a plus one (+1), time for two bites is scored at zero (0), and time for three or more bites is scored at minus one (-1).
Intensity
The intensity of grazing considers the proportion of leaf area the key forage plants had during or at the end of their growing season, or at the end of the grazing period if animals were moved during the growing season. Areas where key forage plants had most of their leaves available for growth at this time are scored plus one (+1 = more than 60 percent leaf area or less than 40 percent utilization). Moderate utilization (41 percent to 55 percent) is scored at zero (0). Areas where key forage plants have been grazed more heavily (less than 56 percent) are scored at minus one (-1).
Opportunity
To evaluate opportunity to grow or regrow, consider the portion of the growing season when grazers are not present, and when plants are growing and/or recovering. If grazing occurs only during the dormant season, and forage plants were rested during the growing season, score plus two (+2). If grazing occurs only during a small fraction of the growing season, and most of it is available for growth or regrowth, score plus one (+1). If grazing occurs during more of the growing season, but there is some chance for growth or regrowth, score opportunity at zero (0). If there is little chance for preferred forage plants to grow or regrow because grazing overlaps most of the growing season, score opportunity at minus one (-1). If grazing is throughout the growing season, score opportunity at minus two (-2).
Use area mapping
To score or plan grazing management using the GRI, first map the pastures and use areas within pastures. A use area within a pasture is a significant area that was grazed differently from other areas within that pasture, and so it would receive a different GRI score. The difference could be based on a difference in utilization, but a difference in season and duration of use will impact the GRI score and plant growth much more. See Swanson et al. (2019a) for ideas on how to create more use areas. Some use areas mapped will be consistent from year to year based on fences, topography, waters that are made available to livestock or not, patterns of seasonal movement, or dual-species grazing. Other use areas may depend on success with stockmanship, supplementation or temporary electric fencing, and weather. To create the table provided, it is best to be optimistic about the number of use areas that can be managed. If not successful at moving animals and getting them to not come back in a given year, two or more use areas can be combined in recognition of their periods of actual use and the impact of longer duration (lower frequency and opportunity scores). Or, labeled use areas may receive the same frequency and opportunity scores, but possibly different intensity scores. To map pastures and use areas, follow these steps:
- Obtain a large map of the ranch, one that has enough detail to see topographic breaks, and mark details such as waters, fences and gates. United State Geological Survey topographic maps can be custom made for low cost through the Nevada Bureau of Mines on the Desert Research Institute campus in Reno. Some ranches may prefer to map using a geographic information system, Google Earth Pro, soil survey maps, satellite imagery or air photos.
- On the map or on a clear overlay, mark the locations of permanent fences and gates. Different qualities of fence - age, design, state of repair, etc. - may be noted by different colors.
- Note on the map the locations of perennial water of sufficient quantity for the whole herd, such as perennial streams or springs.
- Note the location of seasonal waters using colors or notes for the number of livestock that can be watered there during different seasons and years with abundant, normal or drought levels of precipitation. In much of Nevada, to develop a grazing plan, one must first inventory waters and develop a water management plan. Mapping the waters available may help to recognize a need for wells or spring developments (Figure 1), or their maintenance. The amount of water available at various times guides the maximum number of livestock that can be concentrated.
- Mark the locations of other handling facilities for working livestock, such as corrals, loading chutes, etc.
- Mark the names of existing pastures bounded by dependable fences.
- To divide the pasture into different use areas that would naturally or could effectively be grazed at different times for a different duration or at a different intensity, consider :
- Topography, including natural barriers;
- Waters that can be made available to livestock or not;
- Major plant communities that green up or dry up at different times; and
- Patterns of seasonal animal movement, or patterns of use created by different livestock species grazing in different areas or at different times.
- Mark these on the map and name them.
- Consider alternative entry locations to the same field or pasture.
- Consider if/how any of these use areas should be divided because in different years, one part is grazed differently than another because of weather or season of use. Mark these on the map and name them.
- Consider how additional management, such as stockmanship, supplements, temporary electric fencing or water development, could be used to create or reinforce differences in use period to create smaller use areas with shorter duration and longer recovery (higher frequency and opportunity scores). Mark these on the map and name them.
- Place all of the use areas into the tables provided (copied or printed as needed). Put them in an order so that it will be easy in a given year to lump two or more together if use period or intensity or GRI scores are not actually different. Add the plant community name to clarify thoughts about growing season and use periods.
Tables 1a or 1b are intended for planning with GRI or keeping GRI records. Table 2 is intended for taking field notes or scoring GRI as management occurs. Tables 3 and 4 are for tracking GRI scores across years, either with detailed information (Table 3) or the total GRI score (Table 4).
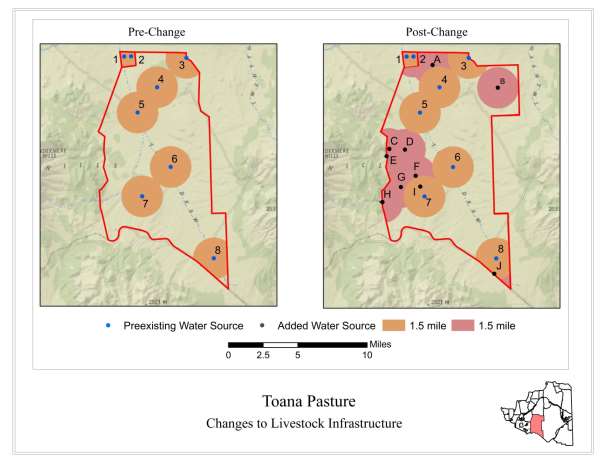
Figure 1. Piospheres, the halos of forage consumption around waters, mapped in Toana Pasture. Areas far from water received little or no use. The Winecup Gamble Ranch identified the need for more waters (letters on right).
How these waters will be used will determine the GRI score for the pasture or use areas within the pasture. Options include:
- A. GRI = minus 3 - Graze the whole pasture at once over the whole of the growing season for an average of moderate utilization (but with more head because of the greater area served by more waters) (GRI intensity score = 0, frequency = -1 and opportunity = -2).
- B. GRI = minus 3 to plus 2 - Graze the whole pasture at once for an average of moderate intensity of use (intensity score = 0) with many more cattle over a part of the growing season (frequency = -1 to +1 depending on the length of the grazing period and opportunity = -2 to +1 depending on the amount of the growing season with cattle in another pasture).
- C. GRI = plus 2 - Graze during the growing season, but make water available in only one use area at any one time. Assuming the same stocking rate (cow days per year) If each water or group of waters supplied cattle for up to 7-10 days and the growing season lasted 6 weeks the GRI score would be (intensity = 0, frequency = +1 and opportunity = +1 for each use area, even though the pasture is used for the same period as in A.
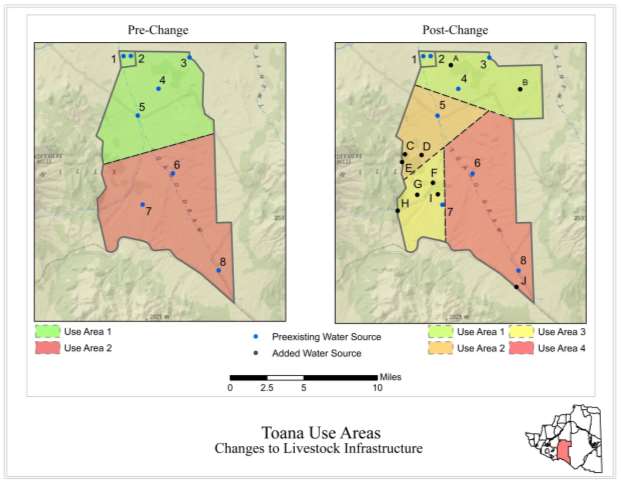
Figure 2. Before water development, the Ranch was able to use Toana pasture as two use areas. This provided some opportunity for shortening the duration of grazing and providing for periods of recovery. After water developments, four use areas became practical by turning water on or off. This improved frequency and opportunity scores like in option C (figure 1).
Summary of GRI scoring
Frequency
Number of times a preferred plant is bitten during active growth, based on duration of grazing during a growing period divided by seven or 10 days.
- Once (or none) = +1
- Twice = 0
- Three or more bites = -1
Intensity
Leaf material remaining for growth at end of growing season grazing.
- Light >60% remaining = +1
- Moderate 45-59% = 0
- Heavy <44% of leaf remaining = -1
Opportunity
Portion of the growing season available for growth or regrowth.
- Full season = +2
- Most = +1
- Some chance = 0
- Little chance = -1
- No chance = -2
Total
(+4 to -4) provides a positive, neutral or negative rating of combined grazing impacts (frequency + intensity + opportunity) for the year.
Table 1a. Scoring or planning for grazing response index. (Long form -- divide fast growth growing season grazing period by 7 days and the slow growth grazing period about 10 days). The growing season dates may, or may not, change among years (columns).
Table 1a: Scoring or planning for grazing response index
| GRI Factors |
Average Year |
Most recent use period |
Planned grazing |
| aPrint as many of these forms as needed for the use areas of the ranch. |
| Use area name |
Plant Community |
| Green up date |
|
|
|
| Fast growth start date |
|
|
|
| Fast growth end date |
|
|
|
| End of growth date |
|
|
|
| Begin grazing date |
|
|
|
| No. of bites / Frequency |
|
|
|
| Intensity score |
|
|
|
| Opportunity score |
|
|
|
| GRI total |
|
|
|
| Use area name |
Plant Community |
| Green up date |
|
|
|
| Fast growth start date |
|
|
|
| Fast growth end date |
|
|
|
| End of growth date |
|
|
|
| Begin grazing date |
|
|
|
| No. of bites / Frequency |
|
|
|
| Intensity score |
|
|
|
| Opportunity score |
|
|
|
| GRI total |
|
|
|
| Use area name |
Plant Community |
| Green up date |
|
|
|
| Fast growth start date |
|
|
|
| Fast growth end date |
|
|
|
| End of growth date |
|
|
|
| Begin grazing date |
|
|
|
| No. of bites / Frequency |
|
|
|
| Intensity score |
|
|
|
| Opportunity score |
|
|
|
| GRI total |
|
|
|
| Use area name |
Plant Community |
| Green up date |
|
|
|
| Fast growth start date |
|
|
|
| Fast growth end date |
|
|
|
| End of growth date |
|
|
|
| Begin grazing date |
|
|
|
| No. of bites / Frequency |
|
|
|
| Intensity score |
|
|
|
| Opportunity score |
|
|
|
| GRI total |
|
|
|
Table 1b. Scoring or planning for grazing response index. (Short form – divide growing season grazing period by
seven days). The growing season dates may, or may not, change among years (columns).
Table 1b. Scoring or planning for grazing response index.
| GRI Factors |
Average Year |
Most recent use period |
Planned grazing |
| Use area name |
Plant Community |
| Green up date |
|
|
|
| End of growth date |
|
|
|
| Begin grazing date |
|
|
|
| End grazing date |
|
|
|
| No. of bites / Frequency |
|
|
|
| Intensity score |
|
|
|
| Opportunity score |
|
|
|
| GRI total |
|
|
|
| Use area name |
Plant Community |
| Green up date |
|
|
|
| End of growth date |
|
|
|
| Begin grazing date |
|
|
|
| End grazing date |
|
|
|
| No. of bites / Frequency |
|
|
|
| Intensity score |
|
|
|
| Opportunity score |
|
|
|
| GRI total |
|
|
|
| Use area name |
Plant Community |
| Green up date |
|
|
|
| End of growth date |
|
|
|
| Begin grazing date |
|
|
|
| End grazing date |
|
|
|
| No. of bites / Frequency |
|
|
|
| Intensity score |
|
|
|
| Opportunity score |
|
|
|
| GRI total |
|
|
|
| Use area name |
Plant Community |
| Green up date |
|
|
|
| End of growth date |
|
|
|
| Begin grazing date |
|
|
|
| End grazing date |
|
|
|
| No. of bites / Frequency |
|
|
|
| Intensity score |
|
|
|
| Opportunity score |
|
|
|
| GRI total |
|
|
|
| Use area name |
Plant Community |
| Green up date |
|
|
|
| End of growth date |
|
|
|
| Begin grazing date |
|
|
|
| End grazing date |
|
|
|
| No. of bites / Frequency |
|
|
|
| Intensity score |
|
|
|
| Opportunity score |
|
|
|
| GRI total |
|
|
|
Table 2 GRI foldable field form to use when moving livestock or when plant growth stops
|
Frequency - Number of bites on preferred plants during active growth = duration of grazing during growth divided by seven to 10 days.
0-1 bites +1; 2 bites 0; 3 bites -1
Intensity - Leaf material remaining at end of growing season grazing:
Light >60% +1; Mod 45-59% 0; <44% -1
Opportunity - Growing season available for growth /regrowth:
Full season +2; Most +1; Some 0; Little -1; None -2
|
Fold here for shirt pocket |
Frequency - Number of bites on preferred plants during active growth = duration of grazing during growth divided by seven to 10 days.
0-1 bites +1; 2 bites 0; 3 bites -1
Intensity - Leaf material remaining at end of growing season grazing:
Light >60% +1; Mod 45-59% 0; <44% -1
Opportunity - Growing season available for growth /regrowth:
Full season +2; Most +1; Some 0; Little -1; None -2
|
| aThis sheet is to be folded here for placement in a shirt pocket for recording observations on actual growing seasons and actual grazing use - at the time of moving animals or at the end of the growing season. |
| Year |
|
Year |
| Use area name |
|
Use area name |
| Plant Community |
|
Plant Community |
| Green up date |
|
Green up date |
| End of growth date |
|
End of growth date |
| Begin grazing date |
|
Begin grazing date |
| End grazing date |
|
End grazing date |
| No. of bites / Frequency |
|
No. of bites / Frequency |
| Intensity score |
|
Intensity score |
| Opportunity score |
|
Opportunity score |
| GRI total |
|
GRI total |
| |
|
|
| |
|
|
Useful References
- Perryman, B. L., L. B. Bruce, P. T. Tueller, and S. R. Swanson. 2006. Ranchers’ Monitoring Guide. University of Nevada Cooperative Extension Educational Bulletin EB-06-04. 48 pp.
- Reed, F., R. Roath, and D. Bradford. 1999. The Grazing Response Index: A Simple and Effective Method to Evaluate Grazing Impacts, Rangelands, August: 3-6. Swanson, S., D. Voth and J. C. Cervantes. 2019 Planning for Plant Growth using the Grazing Response Index.
- Swanson, S., S. Wyman, and C. Evans. 2015. Practical Grazing Management to Maintain or Restore Riparian Functions and Values. Journal of Rangeland Applications, 2:1-28. Swanson, S., B. Schultz, P. Novak-Echenique, K. Dyer, G. McCuin, J. Linebaugh, B. Perryman, P. Tueller, R. Jenkins, B. Scherrer, T. Vogel, D. Voth, M. Freese, R. Shane, and K. McGowan. 2018. Nevada Rangeland Monitoring Handbook, Third Edition. University of Nevada Cooperative Extension Special Publication SP-18-03. 122 pp.
- Teague, Richard, Fred Provenza, Urs Kreuter, Tim Steffens and Matt Barnes. 2013. Multi-paddock grazing on rangelands: Why the perceptual dichotomy between research results and rancher experience? Journal of Environmental Management 128:699-717.
- Wyman S., D. Bailey, M. Borman, S. Cote, J. Eisner, W. Elmore, B. Leinard, S. Leonard, F. Reed, S. Swanson, L. Van Riper, T. Westfall, R. Wiley, and A. Winward. 2006. Riparian Area Management - Management Processes and Strategies for Grazing Riparian- Wetland Areas. U.S. Bureau of Land Mgmt. Technical Reference TR 1737-20. 119 pp.
This publication was supported by Western Sustainable Agriculture Research and Education (Western SARE).
Swanson, S., Voth, D.
2019,
Grazing Response Index Tables for Use Areas,
University of Nevada, Reno, IP-19-04
