Pershing County Agricultural Statistics (2001 - 2002)
To the Providers and Users of Pershing County Agricultural Statistics:
This is the sixth year that University of Nevada, Reno Extension and Nevada Agricultural Statistics Service (NASS) have produced a fact sheet summarizing agricultural data for Pershing County. All of the information in this fact sheet came from the 2001-2002 Nevada Agricultural Statistics Service’s Annual Report and the latest Census of Agriculture report. It is hoped that this county-version will be helpful to those seeking agricultural data pertinent to Pershing County. Special thanks go to the Pershing County farmers and ranchers whose voluntary participation in the NASS surveys provided this information. Questions regarding any of these statistics or additional information are welcomed.
Located in northwestern Nevada, Pershing County’s population reached more than 7,000 in 2000 but has since declined to 6,873. The main industries are mining and agriculture. Pershing County is one of the foremost agricultural production regions in Nevada. However, a severe drought curtailed many agricultural activities during the 2002 growing season. The Census of Agriculture shows the county with 120 farms and ranches covering nearly 120,000 acres excluding public grazing allotment lands. Average farm size is 995 acres. Alfalfa hay, alfalfa seed, and small grains are the principle crops. Sheep and cattle commonly graze dormant fields during the winter months. The county is home to the state’s largest sheep and cattle feedlots. While agricultural production for this past year is valued at approximately $40 million, if one considers the multiplier effect of this production, the total economic impact on the county is much greater.
Table 1. Pershing County Demographics
| Item |
Amount |
| Population |
7460 |
| Size |
3,859,840 acres or 6,031 square miles |
| Number of Farms and Ranches |
120 |
| Land in farms |
119,435 |
| Average size |
995 acres |
| Average Market Value of Products Sold / Farm |
$272,325 |
| Average Production Expenses / Farm |
$229,492 |
Table 2. Agricultural Production
| Item |
Amount |
Value |
| Alfalfa Hay |
26,000 acres harvested |
$ 13,514,800 |
| All Other Hay |
8,000 acres harvested |
$ 3,588,000 |
| Alfalfa Seed |
2,600 acres harvested |
$ 2,015,000 |
| Spring Wheat |
n/a |
n/a |
| Winter Wheat |
1,100 acres harvested |
$ 335,500 |
| Barley |
n/a |
n/a |
| Cattle & Calves |
26,000 head, January 1st inventory |
$ 19,760,000 |
| Sheep |
9,000 head, January 1st inventory |
$ 819,000 |
| |
TOTAL |
$ 40,031,500 |
| n/a data omitted to avoid disclosing individual information. |
Table 3. Average Price Received / Amount Produced
| Item |
Amount ($) / UNIT |
Production / Unit |
| Alfalfa Hay |
113.00 / ton |
4.6 tons / acre |
| All Other Hay |
115.00 / ton |
3.9 tons / acre |
| Alfalfa Seed |
1.25 / pound |
620 pounds / acre |
| Spring Wheat |
n/a |
n/a |
| Winter Wheat |
3.05 / bushel |
96 bushels / acre |
| Barley |
n/a |
n/a |
| Cattle & Calves |
760.00 / head |
n/a |
| Sheep |
91.00 / head |
n/a |
| n/a data omitted to avoid disclosing individual information. |
Alfalfa hay continues to be the most important crop in terms of both acres harvested and value of production. All other hay moved up to second place this year followed by alfalfa seed, and winter wheat.. Together, these crops were valued at $19,452,500 during 2002. Livestock, including cattle and calves, as well as sheep, were valued at $20,579,000.
The census of agriculture counts as a farm every place from which $1,000 or more of agricultural products were produced and sold or normally would have been sold during the census year. It is the only source of uniform, comprehensive agricultural data for every county in the nation. The latest census lists some interesting characteristics concerning farms in Pershing County. The following table shows the number of farms by size and sales.
Table 4. Characteristics of Farms by Size and Sales for Pershing County
| Farms by Size |
Number of Farms |
Farms by Sales |
Number of Farms |
| 1 to 9 acres |
5 |
Less than $2,500 |
20 |
| 10 to 49 acres |
14 |
$2,500 to $4,999 |
9 |
| 50 to 179 acres |
25 |
$5,000 to $9,999 |
12 |
| 180 to 499 acres |
34 |
$10,000 to $24,999 |
16 |
| 500 to 999 acres |
12 |
$25,000 to $49,999 |
14 |
| 1,000 acres or more |
30 |
$50,000 to $99,999 |
20 |
| Total Farms |
120 |
$100,000 or more |
30 |
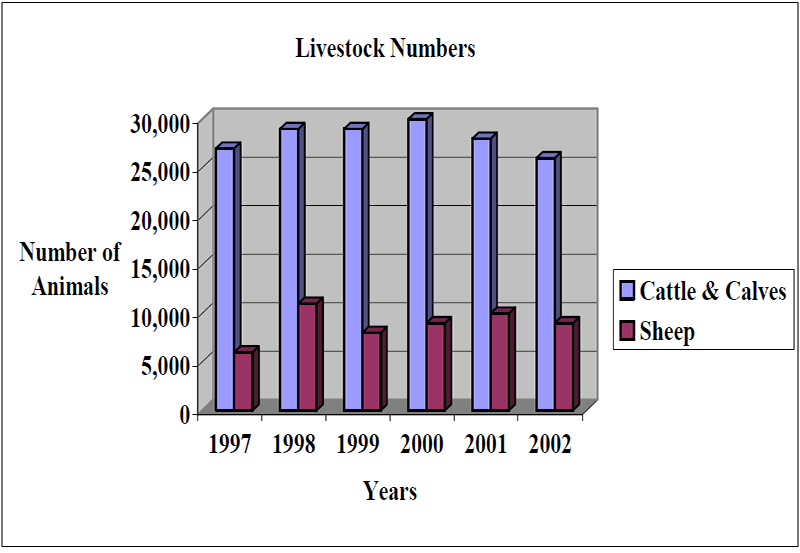
Livestock Numbers in Pershing County
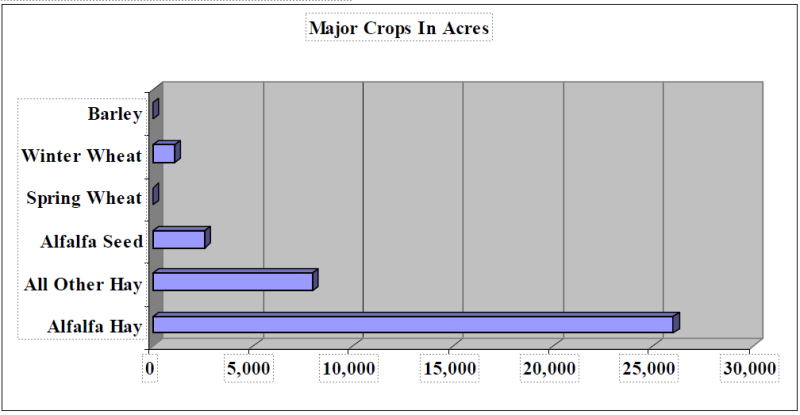 Acres of Major Crops Grown in Pershing County
Table 5. Pershing County Comparison with other Counties
| County |
Cash Receipts ($) |
Rank |
Number of Farms |
Rank/th> |
Average Farm Size (Acres) |
Rank |
Acres in Farm-Ranch |
Rank |
| Carson |
198,000 |
16 |
18 |
16 |
401 |
13 |
7224 |
15 |
| Churchill |
38,058,000 |
4 |
511 |
1 |
253 |
15 |
129,058 |
9 |
| Clark |
18,962,000 |
7 |
209 |
6 |
338 |
14 |
70,741 |
12 |
| Douglas |
8,796,000 |
11 |
156 |
7 |
579 |
10 |
90,372 |
10 |
| Elko |
49,228,000 |
3 |
402 |
2 |
7,103 |
1 |
2,855,472 |
1 |
| Esmeralda |
4,016,000 |
14 |
20 |
15 |
1,373 |
7 |
27,454 |
14 |
| Eureka |
13,133,000 |
9 |
84 |
12 |
2,559 |
5 |
214,966 |
7 |
| Humboldt |
57,315,000 |
1 |
218 |
5 |
3,364 |
3 |
733,418 |
2 |
| Lander |
12,794,000 |
10 |
76 |
13 |
6,935 |
2 |
486,017 |
4 |
| Lincoln |
7,317,000 |
12 |
121 |
9 |
404 |
12 |
48,897 |
13 |
| Lyon |
53,959,000 |
2 |
305 |
3 |
572 |
11 |
174,448 |
8 |
| Mineral |
1,809,000 |
15 |
37 |
14 |
N/A |
N/A |
N/A |
N/A |
| Nye |
27,792,000 |
6 |
144 |
8 |
594 |
9 |
85,534 |
11 |
| Pershing |
32,679,000 |
5 |
120 |
10 |
995 |
8 |
119,435 |
5 |
| Storey |
N/A |
17 |
8 |
17 |
N/A |
N/A |
N/A |
N/A |
| Washoe |
13,247,000 |
8 |
285 |
4 |
2,709 |
4 |
772,115 |
3 |
| White Pine |
7,024,000 |
13 |
115 |
11 |
2,152 |
6 |
247,446 |
6 |
This table is based upon a sample of farms and is taken from the 1997 Census of Agriculture. As can be seen, the cash value of receipts from the 1997 census is considerably less than the total value of production for 2002. While changes to “cash receipts” will change slightly from year to year, this table still provides an overview of the respective rankings of the state’s counties based upon agricultural production values. For any additional information or questions concerning the Pershing County data presented in this fact sheet please contact the authors at their respective addresses
Published by:
Breazeale, D., Owens, M., 2007, Pershing County Agricultural Statistics (2001 - 2002), Extension, University of Nevada, Reno, FS-03-07
An EEO/AA Institution. Copyright © 2026, University of Nevada Cooperative Extension.
A partnership of Nevada counties; University of Nevada, Reno; and the U.S. Department of Agriculture
