INTRODUCTION
Sample costs and returns to raise beef cattle in Douglas County, Nevada, are presented in this publication. This publication is intended to be a guide used to make production decisions, determine potential returns, and prepare business and marketing plans. Practices described are based on the production practices considered typical for a beef cattle cow-calf operation in this region, but may not apply to every operation. A “Your Ranch” column in Table 1 is provided for your use.
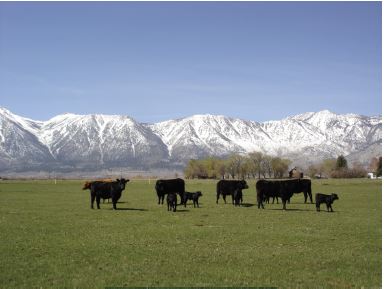
(Photo courtesy of Lena Johnstone)
ASSUMPTIONS
The following assumptions refer to Tables 1 through 3 and reflect the typical costs and returns associated with beef cattle production in Douglas County, Nevada. The practices described are not the recommendations of the University of Nevada, Reno, but rather production practices and materials considered typical of a well-managed beef cattle operation in the region, as determined by a producer panel conducted in October 2006. Costs, materials, and practices are not applicable to all operations, as production practices vary among ranchers within the region.
Ranch Description
Livestock
The livestock inventory consists of 400 cows, 10 bulls and 10 horses. Two replacement bulls are purchased annually, with a useful life of five years. Cow replacement is 10% with a death loss of 5%. The calving rate is 90% with the weaned calf crop produced from over-wintered cows and replacement heifers of 70%. Replacement heifers are selected at weaning and consist of 50 head. At fall evaluation, 40 are brought into the herd as replacements and the remaining 10 are sold as open heifers. Steer calves, non-selected replacement heifers, cull bulls, and cull cows are marketed for delivery in November and December.
Land/Buildings
The representative ranch consists of 300 acres of land for buildings, housing, etc. valued at $1,000.00 an acre. The majority of cattle grazing is conducted on federal lands.
Production Costs and Returns
Feed
The forage base for the ranch consists of summer grazing on federal allotments (mid-April to mid-November), aftermath grazing on meadows, and winter feeding of alfalfa hay and grain. Grass hay and alfalfa costs are based on 2006 market prices. These costs include the full costs of producing the hay (land, equipment, inputs, etc.) and/or purchasing the hay, whichever is lowest. A combination of salt and mineral supplements are provided during the year, a total of 10 tons at $260.00 per ton.
Veterinary/Medical
Cows and replacement heifers receive a pregnancy check in November and are provided with an external insecticide, 7 or 8 Way, and an oral de-wormer. Bulls are also provided with an external insecticide in November and given 7 or 8 Way. Weaned, replacement heifers are provided IBR, BVD, PI3, BRSV, 7 or 8 Way, oral de-wormer, Naselgen, and Bangs vaccinations. Steer and heifer calves are branded, earmarked, de-horned in May, and vaccinated with 7 or 8 Way and Naselgen. Steers are also given implants and castrated in May. Total annual veterinary costs are computed at $20.00 per head.
Marketing/Check-off
Calves are marketed through video marketing sales in the summer with a November/December delivery. Cull animals are marketed through local auction markets. Annual marketing costs are calculated at 2% of total revenue. Check-off fees are $1.00 per animal sold.
Horse Maintenance
Costs for shoeing horses, veterinary, and feed expenses are based on costs as reported by the producer panel; approximately $320.00 annually per head.
Hauling
Hauling cattle to/from auctions or for delivery is estimated at $2.50 per head.
Labor
Labor includes one hired employee, one owner/manager, and summer help from local and owner children. Hired labor costs include a monthly salary of $1,650.00 per hired labor unit. The owner/manager receives $2,400.00 per month as a family draw. All employee benefits, payroll taxes, and workers’ compensation insurance are included in labor costs.
Returns
Returns are based on early 2006 market prices. Returns vary from year to year and across years due to market conditions. A full listing of prices used in this publication can be found in Table 1.
Overhead and Capital Recovery Costs
Cash Overhead
Cash overhead consists of various cash expenses paid out during the year. These costs include property taxes, interest, office expenses, liability and property insurance, as well as investment/machinery repairs. A complete listing of farm investments and associated costs can be found in Table 2.
Interest on Operating Capital
Total operating capital is calculated based on 80% of total operating (variable) costs. The interest on operating capital is calculated at a rate of 6.5% for a six month period.
Property Taxes
Property taxes in Nevada differ across counties. For the purposes of this publication, investment property taxes are calculated at 1% of the average asset value of the property.
Insurance
Insurance costs for farm investments vary, depending on the assets included and the amount of coverage. Property insurance provides coverage for property loss and is charged at .666% of the average asset value. Liability insurance covers accidents on the farm at an annual cost of $3,798.50.
Fuel and Lube
The fuel and lube for all machinery and vehicles is calculated at 8% of the purchase price.
Investment Repairs
Annual repairs are provided for all ranch investments or capital recovery items that require maintenance. Annual repairs are calculated at 2% of the purchase price for buildings and equipment and 7% of the purchase price for machinery and vehicles.
Office & Travel
Office and travel costs are estimated at $2,400.00 for an average year. These expenses include office supplies, telephone service, Internet service, and travel expenses to educational seminars.
Capital Recovery
Capital recovery costs are the annual depreciation (opportunity cost) of all farm investments. Capital recovery costs are calculated using straight line depreciation. Farm equipment may be purchased new or used, depending on producer panel preferences.
Salvage Value
Salvage value is 10% of the new purchase price. It is an estimate of the remaining value of an investment at the end of its useful life. The salvage value for land is the purchase price, as land does not normally depreciate.
Average Asset Value Computation
(Purchase Price + Salvage Value divided by 2)
Straight Line Depreciation Computation
(Purchase Price - Salvage Value divided Useful Life)
REFERENCES
Beef Improvement Federation (1996). Guidelines for Uniform Beef Improvement Programs. Available through the Northwest Research Extension Center, Colby, KS.
Forero, Larry C., Glenn A. Nader, Karen M. Klonsky, Pete Livingston, and Richard L. De Moura (2004). Sample Costs for Beef Cattle Cow-Calf Production, 300 Head, Sacramento Valley. Publication BF-SV-04, University of California Cooperative Extension.
Smathers, Robert (2001). The Costs of Owning and Operating Farm Machinery in the Pacific Northwest 2000. A Pacific Northwest Publication #346. University of Idaho, Washington State University, and Oregon State University.
NOTES
Sample production costs and return publications for significant agricultural products in various regions of Nevada are available online at University of Nevada Cooperative Extension’s website at UNCE. For additional information, contact the Department of Resource Economics at the University of Nevada, Reno at (775) 784-6701 or your local University of Nevada Cooperative Extension office.
Table 1: White Pine County 500 Cow-Calf Production Costs and Returns
| Gross Income |
Weight Per Animal |
Unit of Measure |
Total Units |
Price/Cost Per Unit |
Total Value |
Value/Cost Per Head |
Your Ranch |
| Cull Cows |
1000.00 |
lbs |
40.00 |
$0.47 |
$18,800.00 |
$470.00 |
|
| Cull Bulls |
1500.00 |
lbs |
2.00 |
$0.58 |
$1,740.00 |
$870.00 |
|
| Yearling Replacements |
850.00 |
lbs |
40.00 |
$1.01 |
$34,340.00 |
$858.50 |
|
| Heifer Calves |
500.00 |
lbs |
111.00 |
$1.19 |
$66,045.00 |
$595.00 |
|
| Steer Calves |
575.00 |
lbs |
117.00 |
$1.28 |
$86,112.00 |
$736.00 |
|
| Total Income |
|
|
310.00 |
|
$207,037.00 |
$517.59 |
|
| Operating Costs |
Unit of Measure |
Total Units |
Price/Cost Per Unit |
Total Value |
Value/Cost Per Head |
Your Ranch |
| Grass Hay (Meadow Hay) |
Ton |
$1200.00 |
$48.00 |
$57.600.00 |
$144.00 |
|
| Grain |
Ton |
$20.00 |
$120.00 |
$2,400.00 |
$6.00 |
|
| Alfalfa Hay |
Ton |
$50.00 |
$100.00 |
$5,000.00 |
$12.50 |
|
| BLM Grazing |
AUM |
$3500.00 |
$1.56 |
$5,460.00 |
$13.65 |
|
| Horse (Shoeing, Vet, Feed, etc.) |
Head |
$10.00 |
$320.00 |
$3,200.00 |
$8.00 |
|
| Veterinary/Medical |
Head |
$400.00 |
$20.00 |
$8,000.00 |
$20.00 |
|
| Marketing (Brand, Video, Commission) |
Head |
$310.00 |
$13.36 |
$4,140.74 |
$10.35 |
|
| Checkoff |
Head |
$310.00 |
$1.00 |
$310.00 |
$0.78 |
|
| Trace Salt & Minerals |
Ton |
$10.00 |
$260.00 |
$2,600.00 |
$6.50 |
|
| Hauling |
$ |
$310.00 |
$2.50 |
$775.00 |
$1.94 |
|
| Hired Labor |
Monthly |
$12.00 |
$1,650.00 |
$19,800.00 |
$49.50 |
|
| Operator Labor |
Monthly |
$12.00 |
$2,400.00 |
$28,800.00 |
$72.00 |
|
| Accounting & Legal Fees |
$ |
$1.00 |
$4,000.00 |
$4,000.00 |
$10.00 |
|
| Maintenance (Buildings, Vehicles, etc.) |
$ |
$1.00 |
$9,730.00 |
$9,730.00 |
$24.33 |
|
| Fuel & Lube |
$ |
$1.00 |
$7,776.00 |
$7,776.00 |
$19.44 |
|
| Utilities |
$ |
$1.00 |
$3,500.00 |
$3,500.00 |
$8.75 |
|
| Miscellaneous |
Head |
$400.00 |
$5.00 |
$2,000.00 |
$5.00 |
|
| Interest Operating Capital |
$ |
$132,073.39 |
6.50% |
$4,292.39 |
$10.73 |
|
| Total Operating Costs |
|
|
|
$169,384.13 |
$423.46 |
|
| Income Above Operating Costs |
|
|
|
$37,652.87 |
$94.13 |
|
| Ownership Costs (Capital Recovery (Depreciation) & Cash Overhead) |
Unit of Measure |
Total Units |
Price/Cost Per Unit |
Total Value |
Value/Cost Per Head |
Your Ranch |
| Buildings, Improvements, & Equipment |
$ |
1.00 |
$4,288.60 |
$4,288.60 |
$10.72 |
|
| Machinery & Vehicles |
$ |
1.00 |
$6,331.54 |
$6,331.54 |
$15.83 |
|
| Purchased Livestock (Bulls & Horses) |
$ |
1.00 |
$3,366.67 |
$3,366.67 |
$8.42 |
|
| Liability Insurance |
$ |
1.00 |
$3,798.50 |
$3,798.50 |
$9.50 |
|
| Office & Travel |
$ |
1.00 |
$2,400.00 |
$2,400.00 |
$6.00 |
|
| Interest on Retained Livestock |
$ |
1.00 |
$1,755.00 |
$1,755.00 |
$4.39 |
|
| Annual Investment Insurance |
$ |
1.00 |
$3,913.08 |
$3,913.08 |
$9.78 |
|
| Annual Investment Taxes |
$ |
1.00 |
$5,875.50 |
$5,875.50 |
$14.69 |
|
| Total Ownership Costs |
|
|
|
$31,728.89 |
$79.32 |
|
| Total Costs |
|
|
|
$201,113.02 |
$502.78 |
|
| Net Projected Returns |
|
|
|
$6,923.98 |
$14.81 |
|
Table 2: Investment Summary
| Buildings, Improvements, and Equipment |
Purchase Price |
Salvage Value |
Livestock Share (%) |
Useful Life (yrs) |
Annual Taxes |
Annual
Insurance |
Annual
Capital
Recovery |
Annual
Repairs |
| Large Barn & Pole Barn |
$55,000.00 |
$5,500.00 |
100 |
50.00 |
$302.50 |
$301.47 |
$990.00 |
$1,100.00 |
| Fencing |
$25,000.00 |
- |
100 |
50.00 |
$125.00 |
$83.25 |
$500.00 |
$500.00 |
| Corrals/Working System |
$12,000.00 |
$1,200.00 |
100 |
30.00 |
$66.00 |
$43.96 |
$360.00 |
$240.00 |
| Corral Panels |
$1,500.00 |
$150.00 |
100 |
25.00 |
$8.25 |
$5.49 |
$54.00 |
$30.00 |
| Water Developments |
$3,600.00 |
$360.00 |
100 |
25.00 |
$19.80 |
$13.19 |
$129.60 |
$72.00 |
| Shop & Tools |
$20,000.00 |
$2,000.00 |
60 |
25.00 |
$66.00 |
$43.96 |
$432.00 |
$240.00 |
| Range Improvements |
$1,500.00 |
$150.00 |
100 |
25.00 |
$8.25 |
$5.49 |
$54.00 |
$30.00 |
| Implements |
$20,000.00 |
$2,000.00 |
75 |
20.00 |
$82.50 |
$54.95 |
$675.00 |
$300.00 |
| Flatbed Trailer |
$8,000.00 |
$800.00 |
100 |
20.00 |
$44.00 |
$29.30 |
$360.00 |
$160.00 |
| Tack |
$7,500.00 |
- |
100 |
15.00 |
$37.50 |
$24.98 |
$500.00 |
$150.00 |
| Gooseneck Trailer |
$5,200.00 |
$520.00 |
100 |
20.00 |
$28.60 |
$19.05 |
$234.00 |
$104.00 |
| Housing/Land |
$420,000.00 |
$420,000.00 |
100 |
100.00 |
$4,200.00 |
$2,797.20 |
- |
- |
| Sub Total |
$579.300.00 |
$432,680.00 |
NA |
NA |
$4,988.40 |
$3,322.27 |
$4,288.60 |
$2,926.00 |
| Machinery and Vehicles |
Purchase
Price |
Salvage
Value |
Livestock
Share (%) |
Useful
Life (yrs) |
Annual
Taxes |
Annual
Insurance |
Annual
Capital
Recovery |
Annual
Repairs |
Annual Fuel & Lube |
| 90 HP Tractor |
$13,000.00 |
$1,300.00 |
80 |
25.00 |
$57.20 |
$38.10 |
$374.40 |
$728.00 |
$832.00 |
| 140 HP Tractor/Loader |
$25,000.00 |
$2,500.00 |
80 |
25.00 |
$110.00 |
$73.26 |
$720.00 |
$1,400.00 |
$1,600.00 |
| Pickup (1 ton 4x4) |
$36,000.00 |
$3,600.00 |
50 |
8.00 |
$99.00 |
$65.93 |
$2,025.00 |
$1,260.00 |
$1,440.00 |
| Pickup (1ton 4x4) |
$25,000.00 |
$2,500.00 |
100 |
25.00 |
$137.50 |
$91.58 |
$900.00 |
$1,750.00 |
$2,000.00 |
| 4-Wheeler Gator |
$10,000.00 |
$1,000.00 |
80 |
6.00 |
$44.00 |
$29.30 |
$1,200.00 |
$560.00 |
$640.00 |
| 4-Wheeler |
$6,000.00 |
$600.00 |
80 |
7.00 |
$26.40 |
$17.58 |
$617.14 |
$336.00 |
$384.00 |
| Backhoe |
$11,000.00 |
$1,100.00 |
100 |
20.00 |
$60.50 |
$40.29 |
$495.00 |
$770.00 |
$880.00 |
| Sub Total |
$126,000.00 |
$12,600.00 |
NA |
NA |
$534.60 |
$356.04 |
$6,331.54 |
$6,804.00 |
$7,776.00 |
| Purchased Livestock |
Purchase
Price |
Salvage
Value |
Livestock
Share (%) |
Useful
Life (yrs) |
Annual
Taxes |
Annual
Insurance |
Annual
Capital
Recovery |
Annual
Repairs |
Annual Fuel & Lube |
| Bulls (10) |
$27,000.00 |
$13,500.00 |
100 |
5.00 |
$202.50 |
$134.87 |
$134.87 |
|
|
| Horses (10) |
$20,000.00 |
$10,000.00 |
100 |
15.00 |
$150.00 |
$99.90 |
$99.90 |
|
|
| Sub Total |
$47,000.00 |
$23,500.00 |
NA |
NA |
$352.50 |
$234.77 |
$234.77 |
|
|
| Total |
$752,300.00 |
$468,780.00 |
NA |
NA |
$5,875.50 |
$3,913.08 |
$3,913.08 |
$9,730.00 |
$7,776.00 |
| Retained Livestock (Interest Rate) |
Purchase
Price |
Salvage
Value |
Livestock
Share (%) |
Useful Life (yrs) |
Annual
Capital
Recovery |
| Replacement Heifers (60) |
$27,000.00 |
$27,000.00 |
100 |
|
$1,755.00 |
| Total |
$27,000.00 |
|
NA |
NA |
$1,755.00 |
Table 3: Monthly Cash Flow
| Production |
January |
February |
March |
April |
May |
June |
| Cull Cows |
$9,400.00 |
- |
- |
- |
$9,400.00 |
- |
| Cull Bulls |
$870.00 |
- |
- |
- |
$870.00 |
- |
| Yearling Rep |
$17,170.00 |
- |
- |
- |
$17,170.00 |
- |
| Heifer Calves |
$33,022.50 |
- |
- |
- |
$33,022.50 |
- |
| Steer Calves |
$43,056.00 |
- |
- |
- |
$43,056.00 |
- |
| Total Income |
$103,518.50 |
- |
- |
- |
$103,518.50 |
- |
| Production |
July |
August |
September |
October |
November |
December |
Total |
| Cull Cows |
- |
- |
- |
- |
- |
- |
$18,800.00 |
| Cull Bulls |
- |
- |
- |
- |
- |
- |
$1,740.00 |
| Yearling Rep |
- |
- |
- |
- |
- |
- |
$34,340.00 |
| Heifer Calves |
- |
- |
- |
- |
- |
- |
$66,045.00 |
| Steer Calves |
- |
- |
- |
- |
- |
- |
$86,112.00 |
| Total Income |
- |
- |
- |
- |
- |
- |
$207.037.00 |
| Operating Inputs |
January |
February |
March |
April |
May |
June |
| Grass Hay |
$8,228.57 |
$8,228.57 |
$8,228.57 |
$8,228.57 |
- |
- |
| Grain |
$342.86 |
$343.86 |
$342.86 |
$342.86 |
- |
- |
| Alfalfa Hay |
$714.29 |
$714.29 |
$714.29 |
$714.29 |
- |
- |
| BLM Grazing |
- |
- |
- |
- |
$1,092.00 |
$1,092.00 |
| Horses |
$266.67 |
$266.67 |
$266.67 |
$266.67 |
$266.67 |
$266.67 |
| Veterinary/Medical |
$666.67 |
$666.67 |
$666.67 |
$666.67 |
$666.67 |
$666.67 |
| Marketing |
$2,070.37 |
- |
- |
- |
$2,070.37 |
- |
| Checkoff |
$155.00 |
- |
- |
- |
$155.00 |
- |
| Minerals & Salt |
$216.67 |
$216.67 |
$216.67 |
$216.67 |
$216.67 |
$216.67 |
| Hauling |
$387.50 |
- |
- |
$387.50 |
- |
- |
| Hired Labor |
$1,650.00 |
$1,650.00 |
$1,650.00 |
$1,650.00 |
$1,650.00 |
$1,650.00 |
| Operator Labor |
$2,400.00 |
$2,400.00 |
$2,400.00 |
$2,400.00 |
$2,400.00 |
$2,400.00 |
| Accounting & Legal |
$333.33 |
$333.33 |
$333.33 |
$333.33 |
$333.33 |
$333.33 |
| Maintenance |
$810.83 |
$810.83 |
$810.83 |
$810.83 |
$810.83 |
$810.83 |
| Fuel & Lube |
$648.00 |
$648.00 |
$648.00 |
$648.00 |
$648.00 |
$648.00 |
| Utilities |
$291.67 |
$291.67 |
$291.67 |
$291.67 |
$291.67 |
$291.67 |
| Miscellaneous |
$166.67 |
$166.67 |
$166.67 |
$166.67 |
$166.67 |
$166.67 |
| Interest OC |
- |
- |
- |
- |
- |
- |
| Total Operating Costs |
$19,349.08 |
$16,736.21 |
$16,736.21 |
$16,736.21 |
$11,155.37 |
$8,542.50 |
| Net Returns |
$84,169.42 |
$(16,736.21) |
$(16,736.21) |
$(16,736.21) |
$92,363.13 |
$(8,542.50) |
| Operating Inputs |
July |
August |
September |
October |
November |
December |
Total |
| Grass Hay |
- |
- |
- |
$8,228.57 |
$8,8228.57 |
$8,8228.57 |
$57,600.00 |
| Grain |
- |
- |
- |
$342.86 |
$342.86 |
$342.86 |
$2,400.00 |
| Alfalfa Hay |
- |
- |
- |
$714.29 |
$714.29 |
$714.29 |
$5,000.00 |
| BLM Grazing |
$1,092.00 |
$1,092.00 |
$1,092.00 |
- |
- |
- |
$5,460.00 |
| Horses |
$266.67 |
$266.67 |
$266.67 |
$266.67 |
$266.67 |
$266.67 |
$3,200.00 |
| Veterinary/Medical |
$666.67 |
$666.67 |
$666.67 |
$666.67 |
$666.67 |
$666.67 |
$8,000.00 |
| Marketing |
- |
- |
- |
- |
- |
- |
$4,140.74 |
| Checkoff |
- |
- |
- |
- |
- |
- |
$310.00 |
| Minerals & Salt |
$216.67 |
$216.67 |
$216.67 |
$216.67 |
$216.67 |
$216.67 |
$2,600.00 |
| Hauling |
- |
- |
- |
- |
- |
- |
$775.00 |
| Hired Labor |
$1,650.00 |
$1,650.00 |
$1,650.00 |
$1,650.00 |
$1,650.00 |
$1,650.00 |
$19,800.00 |
| Operator Labor |
$2,400.00 |
$2,400.00 |
$2,400.00 |
$2,400.00 |
$2,400.00 |
$2,400.00 |
$28,800.00 |
| Accounting & Legal |
$333.33 |
$333.33 |
$333.33 |
$333.33 |
$333.33 |
$333.33 |
$4,000.00 |
| Maintenance |
$810.83 |
$810.83 |
$810.83 |
$810.83 |
$810.83 |
$810.83 |
$9,730.00 |
| Fuel & Lube |
$648.00 |
$648.00 |
$648.00 |
$648.00 |
$648.00 |
$648.00 |
$7,776.00 |
| Utilities |
$291.67 |
$291.67 |
$291.67 |
$291.67 |
$291.67 |
$291.67 |
$3,500.00 |
| Miscellaneous |
$166.67 |
$166.67 |
$166.67 |
$166.67 |
$166.67 |
$166.67 |
$2,000.00 |
| Interest OC |
- |
- |
- |
- |
- |
$4,292.39 |
$4,292.39 |
| Total Operating Costs |
$8,542.50 |
$8,542.50 |
$8,542.50 |
$16,736.21 |
$16,736.21 |
$21,028.60 |
$169,384.13 |
| Net Returns |
$(8,542.50) |
$(8,542.50) |
$(8,542.50) |
$(16,736.21) |
$(16,736.21) |
$(21,028.60) |
$37,652.87 |
Curtis, K., Lewis, S., and Ruby, K.
2006,
Douglas County Cow-Calf Production Costs & Returns,
Extension | University of Nevada, Reno, FS-07-11
