Introduction
Alfalfa is the most extensive crop in Nevada with approximately 250,000 acres devoted to its production. The annual value of alfalfa grown in Nevada normally exceeds $200,000,000. (Nevada Agricultural Statistic Service). Alfalfa yields in Nevada have averaged approximately 4.5 tons per acre annually over the past several years. Farm revenue is a direct function of yield per acre, and one important influence of yield is the variety planted. The work described in this publication is focused on the yield of 17 alfalfa varieties planted in a yield trial.
The majority of alfalfa fields in western Nevada are harvested three to four times annually. This production system is dependent on dormant alfalfa varieties that cease growth during the winter months. These types of alfalfa varieties can be classified according to fall dormancy and winter survival ratings.
Fall dormancy in an alfalfa variety refers to the ability of that variety to grow in the fall. Shorter day lengths and colder temperatures are the primary factors that affect, fall dormancy and varieties can differ greatly in their fall dormancy. Alfalfa varieties are rated from 1 to 11, with 1 being the most dormant and 11 being the least-dormant. Generally, less dormant varieties will produce a higher yield than more dormant varieties due to a faster “green-up” in the spring, quicker recovery after a harvest and greater growth in the fall. However, if a grower plants a variety with too large of an fall dormancy rating, the plants are at risk of damage from the plant breaking dormancy too early and being damaged by subsequent freezing temperatures.
Winter survival ratings describe an alfalfa variety’s ability to survive extreme freezing temperatures in winter. Winter survival ratings range from 1 to 6, with 1 being the most winter hardy and 6 being the least. As with fall dormancy ratings, varieties with greater winter survival ratings will generally produce less than those varieties with a lower winter survival rating. Alfalfa breeders, however, have done an excellent job in separating fall dormancy from winter survival. This means that a producer can now buy an alfalfa variety with a higher fall dormancy rating while maintaining an acceptable winter survival rating to protect against winter-kill or damage to the selected variety.
Most alfalfa varieties are also rated for their pest resistance for common alfalfa pests. The Pest resistance ratings are characterized as the percentage of plants in a population that are resistant to the identified pest. They range from 0 to 5 percent for susceptible varieties to greater than 50 percent resistant for those varieties rated as high resistance. In all cases a grower should also select varieties with the highest resistance ratings for the most common pest(s) in their production region.
The National Alfalfa & Forage Alliance, National Alfalfa & Forage Alliance, publishes an annual Alfalfa Variety Ratings sheet that details winter survival, fall dormancy and pest resistance ratings for “alfalfa varieties eligible for certification by seed certifying agencies.” The ratings are obtained from the Association of Official Seed Certifying Agencies (AOSCA) and the National Alfalfa Variety Review Board (NAVRB). This publication also lists the company to contact for marketing information. The publication is available on the web at Alfalfa Variety Ratings.
In western Nevada the most commonly planted alfalfa varieties have a fall dormancy rating of 4 to 5 with an occasional 6. Yet, these varieties are normally very winter hardy, with ratings of 1 to 2.
The alfalfa varieties evaluated in this study included one fall dormancy rating 3, eight with a fall dormancy rating of 4, six with a fall dormancy rating of 5 and one with a fall dormancy rating of 6. The alfalfa varieties evaluated in this trial are listed in Table 1.
Methodology
The variety trial was located on the University of Nevada, Reno Main Station Experimental Farm. It was planted on a Truckee, silt-loam, 0 to 2 percent sloped site, according to the Natural Rescources Conservation Service soil survey for Washoe County. It is rated as prime farmland if irrigated and drained. The available water holding capacity is high, approximately 10.5 inches. The normal frost-free period is 100 to 110 days. A static water table exists during the irrigation season at a depth of 4 feet.
A soil sample was obtained prior to seeding and sent to a private laboratory for analysis. The sample was obtained from the upper 12 inches of soil. It consisted of a composite sample of 20 subsamples taken from the plot area. The analysis indicated that the nutrient levels were generally adequate, with the possibility of a response to manganese applications if tissue samples indicated a deficiency. Yield results did not indicate nutrient deficiencies. Table 2 depicts the soil sample results.
The 17 alfalfa varieties were planted on May 2, 2015 at a rate of 25 pounds per acre Pure Live Seed (PLS). All varieties were seeded approximately ¼ inch deep with a cone seeder, into a clean, firm seedbed, with each seed row firmed by a packing wheel at the time of seeding.
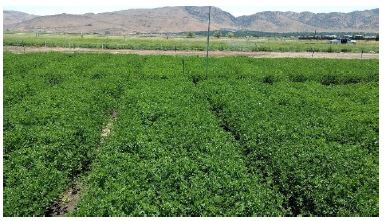
Alfalfa Test Plots Main Station Field Lab, Reno, NV 2016
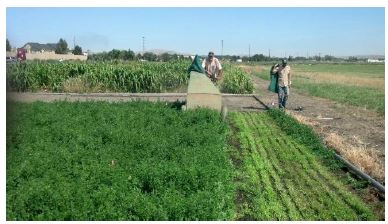
The alfalfa plots and surrounding fields were irrigated with reclaimed sewage effluent from the Truckee Meadows Water Reclamation Chalk Bluff Facility, and have been for a number of years. The facility utilizes a biological nutrient removal process combined with separate nitrification and denitrification processes to remove nitrogen. Phosphorous is removed using biological and chemical processes. These processes result in reclaimed water that has an average pH of 8.0. It is also relatively low in nutrients and total dissolved solids. The soil sample results listed in Table 2 indicate that soil nitrogen and phosphorous levels are in the very high range and should not limit alfalfa production.
The variety trial was irrigated weekly with the reclaimed sewage effluent using sprinklers. The irrigation water supply was unlimited. The 2015 irrigation applications began on May 29 and ended on Oct. 15, 2015. During 2015, a total of 2.25 acre feet was applied to the plots. In 2016, irrigation started on May 17 and ended on Oct. 1. During 2016 (the first full year of production), a total of 1.8 acre feet of water was applied or received as precipitation, with total reference evapotranspiration (ET) recorded as 35.97 inches. The alfalfa plants never displayed any visual evidence of a lack of water, and the authors theorize that the water table supplied adequate water to the alfalfa plants to account for the difference in water applied and recorded ET.
On June 18, 2015, the plots were treated with 5 ounces of Imazethapyr, 8 ounces Clethodim, 1 quart methylated seed oil (MSO) and 1.5 quarts of concentrated ammonium sulfate (AMS) water conditioner per acre in 15 gallons of water per acre. The treatment was targeted to control cool season annual grasses and broadleaved weeds, and was judged to be very effective. The same treatment mix, minus the Imazethapyr, was applied on Aug. 15, 2015 to control warm-season annual grasses. The original treatment regime was again applied on March 23, 2016, and was the last chemical weed control applied.
Rodents (voles, marmots and ground squirrels) caused significant damage to some plots. Damaged areas were noted and adjusted during harvest activities to compensate for obvious damage.
Harvesting Plots 2016
Results
All of the tested varieties performed very well during the 2016 growing season. There were no statistical differences between the first, second and fourth cuttings. The third cutting did result in significant difference between some of the varieties at the P=< 0.04 level. This means that approximately 96 percent of the differences between the varieties are due to the difference in varietal production rather than chance. The varietal means in the “third cut” column followed by the same letter are not different at the P> 0.05 level of probability.
Table 3 displays the results of each cutting by variety and the total seasonal yield for each variety during 2016 with the highest total yield for the season listed first.
When selecting an alfalfa variety that is to be grown when irrigation water can be periodically limiting, it is important to consider the distribution of total yearly production by cutting. Normally the highest yields are obtained in the first cut, with yields declining in subsequent cuts. The percentage of each cut to total annual yield was calculated for each alfalfa variety tested in 2016. That information is presented in Table 4.
Discussion
All of the tested alfalfa varieties produced heavy yields in this evaluation. The average yield in 2016 for the four-cut system was 10.8 tons per acre, with a range of 11.8 tons to 10.2 tons per acre.
All of the yields are higher than can be expected in a field production system due to minimal harvest losses as compared to those that occur under commercial production. Minimal respiration losses occur in this evaluation compared to when harvested alfalfa plants are drying in a windrow. Estimates of dry matter losses from these factors may be as high as 20 percent, but may be even higher when field drying time and leaf loss is excessive.
As expected, the first two cuts resulted in a majority of total yield for the season. These two cuts averaged 61 percent of the total for the season. The final two cuts were nearly equal in yields. It is assumed this was the result of the long, warm fall experienced in 2016 and the longer time between harvests (46 days) than the previous three cuts (approximately 30 days).
Producers reviewing these results should look at relative yields of each variety in combination with other factors, including fall dormancy, winter hardiness and pest resistance ratings, when making a choice about which variety best fits their farming operations.
Further references
1) Owens, M. 2013. Nevada Agricultural Statistics Bulletin 2013. United States Department of Agriculture, National Agricultural Statistics Service. Washington, DC. 53 pp.
2) Undersander, D. 2016. What Does Fall Dormancy of Alfalfa Really Mean? Hay & Forage Grower. Fort Atkinson, WI. February, 2016 p. 14-15.
3) National Alfalfa & Forage Alliance. 2016. Alfalfa Variety Ratings, Winter Survival, Fall Dormancy & Pest Resistance Ratings for Alfalfa varieties. 2016 edition. St. Paul MN. 8 pp.
4) SAS Institute Inc. 2013. SAS version 9.4. SAS Institute Inc., Cary, NC 2013.
Davison, J., Solomon, J. and Lawry, T.
2016,
Alfalfa Variety Trial in Western Nevada, Initial Results,
University of Nevada Cooperative Extension
