It’s very common to hear people say that El Niño winters are wet. Some are, but some are quite dry, and some are remarkable in their averageness. So what are El Niño and La Niña events, and why are they not great predictors of winter precipitation (rain and snow) over most of Nevada?
What is the El Niño Southern Oscillation (ENSO)?
The El Niño Southern Oscillation (ENSO) is a large-scale weather phenomenon that occurs in the Pacific Ocean, near the equator. ENSO’s extremes are called El Niño and La Niña events. Normally, ocean temperatures, also called sea-surface temperatures, are highest in the western Pacific near Indonesia and coolest in the eastern Pacific off coastal Peru and Ecuador (Figure 1). The prevailing trade winds blow from east to west. These trade winds help preserve the east-west difference in sea-surface temperatures, and the difference in ocean temperatures reinforces the trade winds.
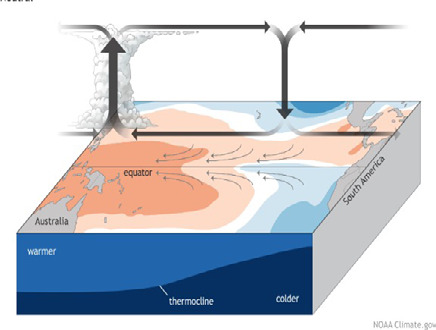
Figure 1: ENSO-Neutral or average conditions across the tropical Pacific Ocean. Climate.gov schematic by Emily Eng and inspired by NOAA PMEL. Used courtesy NOAA climate.gov.
El Niño
Sometimes, the trade winds weaken or even reverse direction, blowing from west to east near Indonesia. The weaker winds allow the relatively warm waters from the western Pacific Ocean to flow east towards the International Date Line (Figure 2). When that happen, the area of most intense storminess moves toward the central Pacific. This tends to reinforce the slowing winds. If waters warm at least 0.5 C (0.9 F) above normal in the Niño 3.4 region (5°S-5°N, 120°W-170°W), it is called an El Niño event or just an El Niño. When the warm water moves east, it also changes wind and atmospheric pressure patterns. Peak tropical storminess shifts toward the central Pacific Ocean. Outside of the tropics, the autumn and winter storm track over the northern Pacific Ocean often moves south of its usual location (Figure 3). El Niños typically start to develop during the spring or summer, remain in place through the winter, and end the following spring. Some El Niño events last longer than a year.
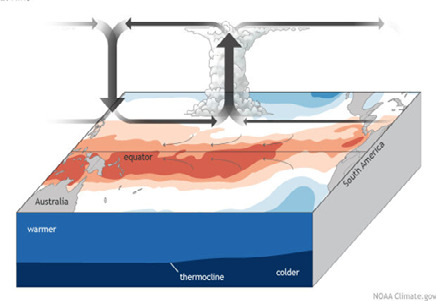
Figure 2: Typical El Niño conditions in the tropical Pacific Ocean. Climate.gov schematic by Emily Eng and inspired by NOAA PMEL. Used courtesy NOAA climate. gov.
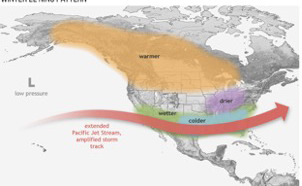
Figure 3: During El Niño winters, the storm track over the Pacific Ocean is typically farther south. Winter weather is often, but not always, cooler and wetter across the southern US, but warmer and often drier farther north. Image courtesy NOAA climate.gov.
La Niña
At other times, the trade winds strengthen, pushing the warmest waters even farther west and causing very cold deep ocean water to upwell along the coast of South America (Figure 4). If the ocean temperatures drop 0.5 C (0.9 F) below normal in the Niño3.4 region, it is considered a La Niña event or a La Niña. La Niñas also tend to develop in the spring and summer. It is not uncommon for La Niñas events to last two or (less commonly) even three years. During winters with La Niñas, the storm track usually moves farther north (Figure 5).
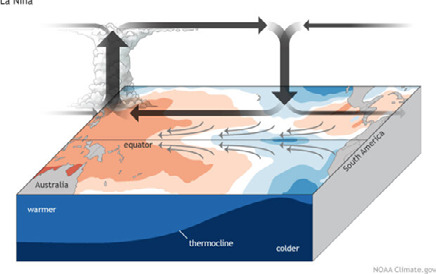
Figure 4: Typical La Niña conditions in the tropical Pacific Ocean. Climate.gov schematic by Emily Eng and inspired by NOAA PMEL. Used courtesy NOAA climate. gov.
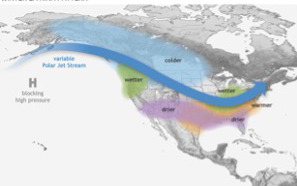
Figure 5: During La Niña winters, the storm track over the Pacific Ocean is typically farther north. Winter weather is often, but not always, drier across the southern US, but cooler and often wetter farther north. Image courtesy NOAA climate.gov.
What do El Niño and La Niña mean for weather in the U.S.?
During El Niños, states in the southern part of the U.S. often, but not always, have a cooler, wetter fall and winter. The southward-shifted storm track delivers more rain and snow than usual. Those same storms also come with cooler temperatures and cloudy conditions. The reverse is often true in the Pacific Northwest. El Niño winters are, on average, warmer and drier than usual. When La Niña conditions prevail in the tropical Pacific, the already cool, wet Pacific Northwest is typically cooler and wetter than normal, while the warmer, drier Southwest often sees an increase in those conditions.
Nevada’s not really in the Southwest or the Pacific Northwest, so what do El Niño and La Niña mean for Nevada?
Far southern Nevada—Clark County and the southern parts of Nye and Lincoln counties—has the same relationship to El Niño and La Niña that the Southwest does. El Niño winters are often (but not always) cooler and wetter than usual, while La Niña winters are often warmer and drier than usual. When the storm track is farther south, more storms are delivered to the southern part of the state, leading to a wetter winter. In the rest of the state, El Niño and La Niña do not consistently predict fall, winter or spring precipitation. El Niños and La Niñas can both be wetter than usual, drier than usual, or kind of remarkable in their averageness. Because Nevada is mostly north of the Southwest and south of the Northwest, neither northward nor southward shifts in the storm track have a strong, consistent influence on the number of storms, how much moisture they bring, or how much makes it over the Sierra Nevada.
There are many indices that track ENSO conditions and can be used to identify whether an El Niño or a La Niña is occurring. These include the Niño3.4 Index, which tracks sea-surface temperatures, and the Southern Oscillation Index, which compares sea-level pressures at Darwin, Australia and in Tahiti. The Multivariate ENSO Index tracks concurrent changes in sea-surface temperature, pressure patterns, winds and cloud cover. Here we use the Oceanic Niño Index or ONI. The ONI is the average three-month sea-surface temperature anomaly in the Niño3.4 region from the NOAA Climate Prediction Center.
In the ONI, temperatures consistently more than 0.5 C warmer than normal indicate El Niño conditions. Temperatures consistently more than 0.5 C cooler than normal indicate La Niña conditions. The larger the anomaly—how much warmer or cooler than normal—the stronger the event. Our analyses use only El Niño and La Niña events since 1960 that Golden Gate Weather Services identifies as Moderate, Strong or Very Strong in the ONI, in order to keep the graphs that accompany this fact sheet clear and easy to interpret.
| Oceanic Niño Index (C) |
| El Niño years |
October – December |
January - March |
| 1963-64 |
+1.4 |
+0.6 |
| 1965-66 |
+2.0 |
+1.2 |
| 1968-69 |
+0.7 |
+1.1 |
| 1972-73 |
+2.1 |
+1.2 |
| 1982-83 |
+2.2 |
+1.9 |
| 1986-87 |
+1.1 |
+1.2 |
| 1987-88 |
+1.3 |
+0.5 |
| 1991-92 |
+1.2 |
+1.6 |
| 1994-95 |
+1.0 |
+0.7 |
| 1997-98 |
+2.4 |
+1.9 |
| 2002-03 |
+1.3 |
+0.6 |
| 2009-10 |
+1.4 |
+1.2 |
| 2015-16 |
+2.6 |
+2.1 |
| Oceanic Niño Index (C) |
| La Niña years |
October – December |
January - March |
| 1970-71 |
-0.9 |
-1.4 |
| 1973-74 |
-1.9 |
-1.6 |
| 1975-76 |
-1.4 |
-1.2 |
| 1988-89 |
-1.8 |
-1.4 |
| 1995-96 |
-1.0 |
-0.8 |
| 1998-99 |
-1.5 |
-1.3 |
| 1999-00 |
-1.5 |
-1.4 |
| 2000-01 |
-0.7 |
-0.5 |
| 2007-08 |
-1.5 |
-1.5 |
| 2010-11 |
-1.6 |
-1.2 |
| 2011-12 |
-1.1 |
-0.7 |
| 2020-21 |
-1.3 |
-0.9 |
Accompanying this fact sheet are a set of graphs that show precipitation amounts during El Niño and La Niña at weather stations around Nevada from 1960 through 2022. We used weather stations with the most complete precipitation records. If there were more than three days missing data in any month’s record, we did not tally total precipitation for the season. For each station, graphs show the total amount of precipitation, both rain and melted snow, in the autumn (September through November) on the left, in the winter (December through February) in the middle, and in the spring (March through May) on the right. Seasonal precipitation amounts in years with El Niño events are shown on the left in blue, and seasonal precipitation amounts during La Niña events are shown on the right in silver. The three strongest El Niño events (1982-83, 1995-96, and 2015-16) and the three strongest La Niña events (1973-74, 1988-89, and 2010-11) were labeled to show the effect of ENSO-event strength on precipitation. In the autumn graphs, the dots are labeled the with the “event” year not their calendar year. So, the dots labeled 1983 represent September – November 1982, while the dots labeled 1983 in the other season are from the 1983 calendar year. Below each graph is a table of seasonal precipitation amounts and the total precipitation from September through May. Table entries of M indicate that at least one month in that season was missing more than three days of data.
These plots show what we would expect from an overall understanding of how El Niño and La Niña affect the storm track. Towns farther south, such as Pioche and Tonopah, are often wetter during El Niños than during La Niñas. Towns farther north, such as Winnemucca and Eureka, have wet, dry and normal La Niñas and wet, dry and normal El Niños. There’s simply not much difference in precipitation between the two events.
It's common to hear that El Niño years are likely to be wet or La Niña years are likely to be dry, and it’s tempting to use that information for planning. But, that’s only true in southern Nevada. In most of the state, ENSO is not a good predictor of how much rain and snow will fall. El Niño and La Niña years can be wet, dry, or in between. Looking at local evidence from Nevada will be more useful than planning based on information from other states.
References and Resources
SC-ACIS. https://scacis.rcc-acis.org/
Climate.gov. (2016). El Niño and La Niña: Frequently asked questions. News & Features. Understanding climate. https://www.climate.gov/ news-features/understanding-climate/el-ni%C3%B1o-and-la-ni%C3%B1a-frequently-asked-questions
Lindsey, R. (2017). How El Niño and La Niña affect the winter jet stream and U.S. Climate. News & Features. Featured Images. https://www.climate. gov/news-features/featured-images/how-el-ni%C3%B1o-and-la-ni%C3%B1a-affect-winter-jet-stream-and-us-climate
L’Heureux, M. (2020). The rise of El Niño and La Niña. News & Features. ENSO Blog. https://www.climate.gov/news-features/blogs/enso/rise-elni%C3%B1o-and-la-ni%C3%B1a
L’Heureux, M. (2014). What is the El Niño-Southern Oscillation. (ENSO) in a nutshell? News & Features. ENSO Blog. https://www.climate.gov/ news-features/blogs/enso/what-el-ni%C3%B1o%E2%80%93southern-oscillation-enso-nutshell
Null, J. (2023). El Niño and La Niña Years and Intensities. Golden Gate Weather Services. https://ggweather.com/enso/oni.htm
Preece, J. R., Shinker, J. J., Riebe, C. S., & Minckley, T. A. (2021). Elevation‐dependent precipitation response to El Niño‐Southern oscillation revealed in headwater basins of the US central Rocky Mountains. International Journal of Climatology, 41(2), 1199-1210.
Wise, E. K. (2010). Spatiotemporal variability of the precipitation dipole transition zone in the western United States. Geophysical Research Letters, 37(7).
The University of Nevada, Reno is committed to providing a place of work and learning free of discrimination on the basis of a person's age (40 or older), disability, whether actual or perceived by others (including service-connected disabilities), gender (including pregnancy related conditions), military status or military obligations, sexual orientation, gender identity or expression, genetic information, national origin, race (including hair texture and protected hairstyles such as natural hairstyles, afros, bantu knots, curls, braids, locks and twists), color, or religion (protected classes). Where discrimination is found to have occurred, the University will act to stop the discrimination, to prevent its recurrence, to remedy its effects, and to discipline those responsible.
Copyright © 2023, University of Nevada, Reno Extension All rights reserved. No part of this publication may be reproduced, modified, published, transmitted, used, displayed, stored in a retrieval system, or transmitted in any form or by any means electronic, mechanical, photocopy, recording or otherwise without the prior written permission of the publisher and authoring agency.
A partnership of Nevada counties; University of Nevada, Reno; and the U.S. Department of Agriculture
For the complete fact sheet with appendices, use the link at the bottom of this page to download the PDF version.
...


