Walker River Indian Reservation: Community Needs and Issues
Introduction
The Walker River Paiute Indian Reservation is located 32 miles north of Hawthorne, Nevada, and is confined primarily within the boundaries of Mineral County. The reservation was established on November 29, 1859 by a letter from the Indian Affairs Commissioner to the General Land Office requesting that land from sale or settlement. The reservation is composed of 323,405 acres. The constitution of the Walker River Paiute Tribe was ratified on May 8, 1937 and the Tribe is known as the Agai Dicutta -Trout Eaters (Bureau of Indian Affairs, 2000).
The township of Schurz is the largest community located on the Walker River Paiute Indian Reservation. The population of Schurz increased from 617 people in the 1990 Census to 721 people in the 2000 Census. (Census Bureau, 2000) According to the Bureau of Indian Affairs, there are several types of housing units on the reservation that include Home Improvement Program (HIP dwellings, Manufactured homes, Housing and Urban Development (HUD) low rent/mutual help units, and private standard/substandard housing. the Bureau of Indian Affairs estimated in 2000 that there were 370 housing units on the reservation (Bureau of Indian Affairs, 2000).
There are an abundance of natural resources on the reservation that remain untapped which include farmlands, recreation, minerals, wildlife, rangeland, undetermined tribal lands, water and others. Although, the Walker River runs through the reservation and eventually into Walker Lake, water right allocation has been limited by Federal Court Decree (C-125) thus limiting future farmland and other development activities. Recreational activities are available including but not limited to fishing, hiking, camping and off-road sports. While mineral deposits have been found, the Tribe must determine the cost-benefit to the reservation by weighing economic benefit versus local values (Bureau of Indian Affairs, 2000).
A comprehensive survey of residents on the Walker River Indian Reservation required that the reservation's needs assessment be reported in multiple fact sheets. This fact sheet reports on community risk factors and community concerns. The other fact sheets report on youth development and quality of life/community demographics.
Walker River Indian Reservation: Survey of All Residents
A formal survey instrument was created with the Walker River Paiute Tribe. The Tribe passed Resolution WR-88-2005 in August 2005 enabled the University of Nevada Cooperative Extension to conduct a needs assessment by surveying all households on the reservation and compiling and reporting the results. The survey was conducted from November 9, 2005 to December 30, 2005 through door-to-door and face-to-face contact.
The survey instrument was designed as an "opinion poll" of community expectations, concerns and issues. It included 9 sections regarding community risk factors, youth risk factors, quality of life, community concerns, substance abuse, health concerns, operation of tribal government, law and order codes and community demographics.
Methodology
The survey was completed in 2005 on the Walker River Indian Reservation. The Walker River Paiute Tribal Housing authority estimated the number of houses on the reservation for this research at 350. The survey team divided the reservation into 3 sections using area-frame maps (Salant & Dillman, 1994). Potential respondents of a household were asked to participate by filling out the survey instrument. There was a 48% response rate from reservation households. A total of 107 households participated in the study and 61 households declined to participate in the study.
Survey administration procedures were designed to help protect the privacy and anonymity of all participating respondents of a household. Respondents are representative of households in Schurz, Nevada and/or Walker River Indian Reservation.
Community Risk Factors
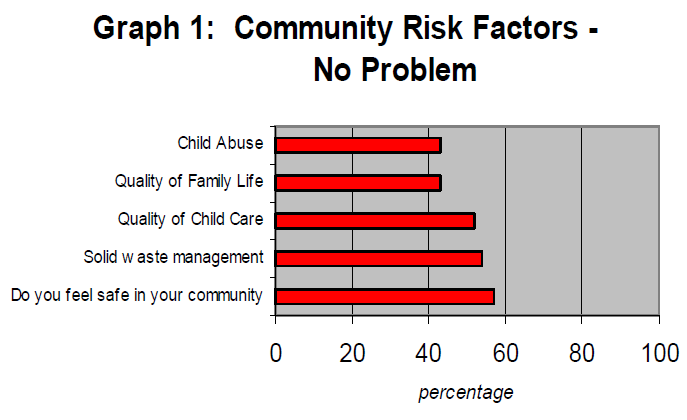
Household respondents were asked 17 questions to prioritize identified community risk factors. Community risk factors were identified through community meetings, tribal council meetings and tribal department meetings. Respondents were asked to give each possible risk factor in the survey instrument a rating (1 through 4). The rating of "1" equaled major problem and the rating of "4" equaled no problem. Graph 1 prioritized the top 5 community risk factors that were not a problem. Graph 2 prioritized the top community risk factors that were a major problem.
In comparing Graph 1 and Graph 2, there are some differences. Graph 1 portrays community risk factors that were found not to be major problems in the community. The percentage of respondents that reported No Problem by respondents are child abuse (43%), quality of family life (43%), quality of child care (52%), solid waste management (54%) and do you feel safe in your community (57%). It is important to note the percentage of respondents on each of the community risk factors. The percentage of respondents that reported No Problem is 43% to 52%.
Data From Graph 1
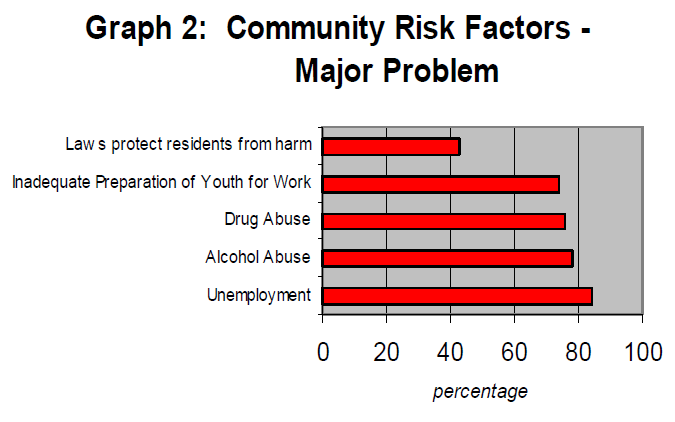
Graph 2 portrays the highest rated community risk factors under Major Problem (1 and 2 ratings). Unemployment (84%), Alcohol Abuse (78%), Drug Abuse (76%), inadequate preparation of youth for the work world (74%) and laws on the reservation protect residents from being harmed (68%) are the major problem community risk factors. It is important to note that a high percentage of respondents (68% to 84%) reported "Major Problems" on the community risk factors.
Data From Graph 2
Community Concerns
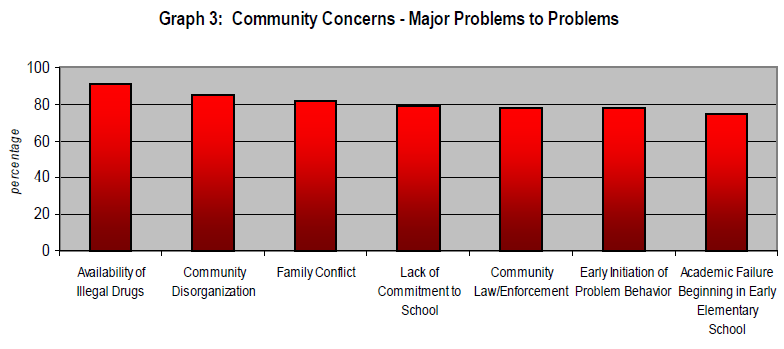
Participating household respondents were asked 12 questions to prioritize identified community concerns. Respondents were asked to give each possible community concern in the survey instrument a rating (1 through 4). The rating of "1" equaled major concern and the rating of "4" equaled no concern. Graph 3 prioritized the top 7 community concerns.
Respondents prioritized the community concerns as follows: availability of illegal drugs (91%); community disorganization (85%); family conflict (82%); lack of commitment to school (79%); community laws/enforcement (78%); early initiation of problem behavior (78%); and academic failure beginning in early elementary school. It is important to note that 91% of respondents rated availability of illegal drugs the number one community concern.
Community Law & Order Code
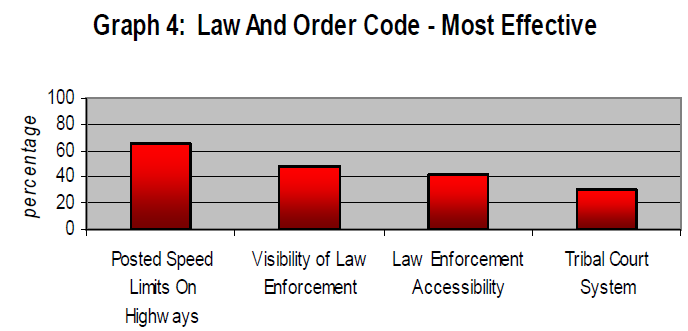
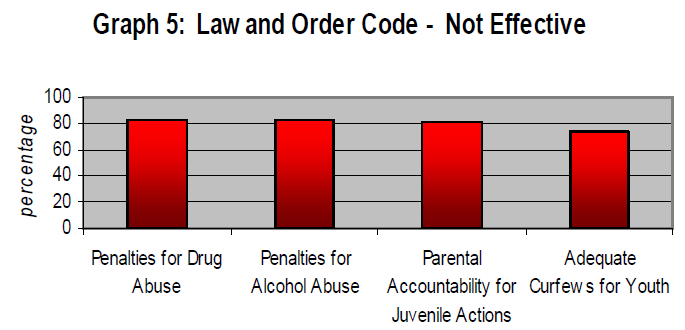
The Walker River Paiute Tribe has its own set of laws on the reservation that govern law enforcement. Nevada Revised Statues apply in some circumstances. Respondents were asked 9 questions about laws on the reservation. Respondents were asked to give identified laws a rating of 1, effective, to 4, not effective. Graph 4 and Graph 5 represent respondents' reports for the most effective and least effective laws on the reservation.
Data From Graph 3
Data From Graph 4
Data From Graph 5
Conclusions
Surveys are scientific tools in research that gather accurate and useful information in which a target population's opinions and characteristics can be identified. Survey results are not absolutes, and are just one of many ways to make assessment of a target population. The target population in this research study was 350 households located on the Walker River Paiute Indian Reservation. There was a 48% survey response rate with 61 respondents declining to participate in the study and 107 respondents participating in the study.
Participating households were asked 17 questions to prioritize identified "Community Risk Factors." The number one prioritized Community Risk Factor was unemployment followed by alcohol and drug abuse. Once the risk factors were prioritized, participating households were asked 12 questions to prioritize "Community Concerns." The top four community concerns were availability of illegal drugs, community disorganization, family conflict and lack of commitment to school. Also discussed were the law and order codes on the reservation as to which were effective and were not effective. The most effective law on the reservation was posted speed limits on highways while the most ineffective law on the reservation was having penalties for drug and alcohol abuse.
The results of this study provide a foundation for developing programs to meet the needs of the reservation community. The data can be further explored with additional information gathering so that effective programs can be developed to address the top ranked priorities: unemployment; community disorganization; and alcohol and drug abuse.
References
- Bureau of Indian Affairs, Western Region. 2000. Indians of Arizona, Nevada, Utah. United States Department of Interior.
- Salant, P. and Dillman D.A., 1994. How to Conduct Your Own Survey. New York: John Wiley & Sons, Inc.
- United States Census Bureau. 2006. Web Address: Census.
Graph 1: Community Risk Factors - No Problem
| Factor |
Percentage |
| Child Abuse |
43% |
| Quality of Family Life |
43% |
| Quality of Child Care |
52% |
| Solid waste management |
54% |
| Do you feel safe in your community |
57% |
Graph 2: Community Risk Factors - Major Problem
| Factor |
Percentage |
| Laws protect residents from harm |
68% |
| Inadequate Preparation of Youth for Work |
74% |
| Drug Abuse |
76% |
| Alcohol Abuse |
78% |
| Unemployment |
84% |
Graph 3: Community Risk Factors - Major Problem
| Factor |
Percentage |
| Availability of Illegal Drugs |
91% |
| Community Disorganization |
85% |
| Family Conflict |
82% |
| Lack of Commitment to School |
79% |
| Community Law/Enforcement |
78% |
| Early Initiation of Problem Behavior |
78% |
| Academic Failure Beginning in Early Elementary School |
78% |
Graph 4: Law And Order Code - Most Effective
| Factor |
Percentage |
| Posted Speed Limits On Highways |
68% |
| Visibility of Law Enforcement |
48% |
| Law Enforcement Accessibility |
41% |
| Tribal Court System |
26% |
Graph 5: Law and Order Code - Not Effective
| Factor |
Percentage |
| Penalties for Drug Abuse |
82% |
| Penalties for Alcohol Abuse |
82% |
| Parental Accountability for Juvenile Actions |
81% |
| Adequate Curfews for Youth |
76% |
Emm, S.
2006,
Walker River Indian Reservation: Community Needs and Issues,
Extension | University of Nevada, Reno, FS-06-62
Learn more about the author(s)
Walker River Indian Reservation: Community Needs and Issues
Introduction
The Walker River Paiute Indian Reservation is located 32 miles north of Hawthorne, Nevada, and is confined primarily within the boundaries of Mineral County. The reservation was established on November 29, 1859 by a letter from the Indian Affairs Commissioner to the General Land Office requesting that land from sale or settlement. The reservation is composed of 323,405 acres. The constitution of the Walker River Paiute Tribe was ratified on May 8, 1937 and the Tribe is known as the Agai Dicutta -Trout Eaters (Bureau of Indian Affairs, 2000).
The township of Schurz is the largest community located on the Walker River Paiute Indian Reservation. The population of Schurz increased from 617 people in the 1990 Census to 721 people in the 2000 Census. (Census Bureau, 2000) According to the Bureau of Indian Affairs, there are several types of housing units on the reservation that include Home Improvement Program (HIP dwellings, Manufactured homes, Housing and Urban Development (HUD) low rent/mutual help units, and private standard/substandard housing. the Bureau of Indian Affairs estimated in 2000 that there were 370 housing units on the reservation (Bureau of Indian Affairs, 2000).
There are an abundance of natural resources on the reservation that remain untapped which include farmlands, recreation, minerals, wildlife, rangeland, undetermined tribal lands, water and others. Although, the Walker River runs through the reservation and eventually into Walker Lake, water right allocation has been limited by Federal Court Decree (C-125) thus limiting future farmland and other development activities. Recreational activities are available including but not limited to fishing, hiking, camping and off-road sports. While mineral deposits have been found, the Tribe must determine the cost-benefit to the reservation by weighing economic benefit versus local values (Bureau of Indian Affairs, 2000).
A comprehensive survey of residents on the Walker River Indian Reservation required that the reservation's needs assessment be reported in multiple fact sheets. This fact sheet reports on community risk factors and community concerns. The other fact sheets report on youth development and quality of life/community demographics.
Walker River Indian Reservation: Survey of All Residents
A formal survey instrument was created with the Walker River Paiute Tribe. The Tribe passed Resolution WR-88-2005 in August 2005 enabled the University of Nevada Cooperative Extension to conduct a needs assessment by surveying all households on the reservation and compiling and reporting the results. The survey was conducted from November 9, 2005 to December 30, 2005 through door-to-door and face-to-face contact.
The survey instrument was designed as an "opinion poll" of community expectations, concerns and issues. It included 9 sections regarding community risk factors, youth risk factors, quality of life, community concerns, substance abuse, health concerns, operation of tribal government, law and order codes and community demographics.
Methodology
The survey was completed in 2005 on the Walker River Indian Reservation. The Walker River Paiute Tribal Housing authority estimated the number of houses on the reservation for this research at 350. The survey team divided the reservation into 3 sections using area-frame maps (Salant & Dillman, 1994). Potential respondents of a household were asked to participate by filling out the survey instrument. There was a 48% response rate from reservation households. A total of 107 households participated in the study and 61 households declined to participate in the study.
Survey administration procedures were designed to help protect the privacy and anonymity of all participating respondents of a household. Respondents are representative of households in Schurz, Nevada and/or Walker River Indian Reservation.
Community Risk Factors
Household respondents were asked 17 questions to prioritize identified community risk factors. Community risk factors were identified through community meetings, tribal council meetings and tribal department meetings. Respondents were asked to give each possible risk factor in the survey instrument a rating (1 through 4). The rating of "1" equaled major problem and the rating of "4" equaled no problem. Graph 1 prioritized the top 5 community risk factors that were not a problem. Graph 2 prioritized the top community risk factors that were a major problem.
In comparing Graph 1 and Graph 2, there are some differences. Graph 1 portrays community risk factors that were found not to be major problems in the community. The percentage of respondents that reported No Problem by respondents are child abuse (43%), quality of family life (43%), quality of child care (52%), solid waste management (54%) and do you feel safe in your community (57%). It is important to note the percentage of respondents on each of the community risk factors. The percentage of respondents that reported No Problem is 43% to 52%.
Data From Graph 1
Graph 2 portrays the highest rated community risk factors under Major Problem (1 and 2 ratings). Unemployment (84%), Alcohol Abuse (78%), Drug Abuse (76%), inadequate preparation of youth for the work world (74%) and laws on the reservation protect residents from being harmed (68%) are the major problem community risk factors. It is important to note that a high percentage of respondents (68% to 84%) reported "Major Problems" on the community risk factors.
Data From Graph 2
Community Concerns
Participating household respondents were asked 12 questions to prioritize identified community concerns. Respondents were asked to give each possible community concern in the survey instrument a rating (1 through 4). The rating of "1" equaled major concern and the rating of "4" equaled no concern. Graph 3 prioritized the top 7 community concerns.
Respondents prioritized the community concerns as follows: availability of illegal drugs (91%); community disorganization (85%); family conflict (82%); lack of commitment to school (79%); community laws/enforcement (78%); early initiation of problem behavior (78%); and academic failure beginning in early elementary school. It is important to note that 91% of respondents rated availability of illegal drugs the number one community concern.
Community Law & Order Code
The Walker River Paiute Tribe has its own set of laws on the reservation that govern law enforcement. Nevada Revised Statues apply in some circumstances. Respondents were asked 9 questions about laws on the reservation. Respondents were asked to give identified laws a rating of 1, effective, to 4, not effective. Graph 4 and Graph 5 represent respondents' reports for the most effective and least effective laws on the reservation.
Data From Graph 3
Data From Graph 4
Data From Graph 5
Conclusions
Surveys are scientific tools in research that gather accurate and useful information in which a target population's opinions and characteristics can be identified. Survey results are not absolutes, and are just one of many ways to make assessment of a target population. The target population in this research study was 350 households located on the Walker River Paiute Indian Reservation. There was a 48% survey response rate with 61 respondents declining to participate in the study and 107 respondents participating in the study.
Participating households were asked 17 questions to prioritize identified "Community Risk Factors." The number one prioritized Community Risk Factor was unemployment followed by alcohol and drug abuse. Once the risk factors were prioritized, participating households were asked 12 questions to prioritize "Community Concerns." The top four community concerns were availability of illegal drugs, community disorganization, family conflict and lack of commitment to school. Also discussed were the law and order codes on the reservation as to which were effective and were not effective. The most effective law on the reservation was posted speed limits on highways while the most ineffective law on the reservation was having penalties for drug and alcohol abuse.
The results of this study provide a foundation for developing programs to meet the needs of the reservation community. The data can be further explored with additional information gathering so that effective programs can be developed to address the top ranked priorities: unemployment; community disorganization; and alcohol and drug abuse.
References
- Bureau of Indian Affairs, Western Region. 2000. Indians of Arizona, Nevada, Utah. United States Department of Interior.
- Salant, P. and Dillman D.A., 1994. How to Conduct Your Own Survey. New York: John Wiley & Sons, Inc.
- United States Census Bureau. 2006. Web Address: Census.
Graph 1: Community Risk Factors - No Problem
| Factor |
Percentage |
| Child Abuse |
43% |
| Quality of Family Life |
43% |
| Quality of Child Care |
52% |
| Solid waste management |
54% |
| Do you feel safe in your community |
57% |
Graph 2: Community Risk Factors - Major Problem
| Factor |
Percentage |
| Laws protect residents from harm |
68% |
| Inadequate Preparation of Youth for Work |
74% |
| Drug Abuse |
76% |
| Alcohol Abuse |
78% |
| Unemployment |
84% |
Graph 3: Community Risk Factors - Major Problem
| Factor |
Percentage |
| Availability of Illegal Drugs |
91% |
| Community Disorganization |
85% |
| Family Conflict |
82% |
| Lack of Commitment to School |
79% |
| Community Law/Enforcement |
78% |
| Early Initiation of Problem Behavior |
78% |
| Academic Failure Beginning in Early Elementary School |
78% |
Graph 4: Law And Order Code - Most Effective
| Factor |
Percentage |
| Posted Speed Limits On Highways |
68% |
| Visibility of Law Enforcement |
48% |
| Law Enforcement Accessibility |
41% |
| Tribal Court System |
26% |
Graph 5: Law and Order Code - Not Effective
| Factor |
Percentage |
| Penalties for Drug Abuse |
82% |
| Penalties for Alcohol Abuse |
82% |
| Parental Accountability for Juvenile Actions |
81% |
| Adequate Curfews for Youth |
76% |
Published by:
Emm, S., 2006, Walker River Indian Reservation: Community Needs and Issues, Extension | University of Nevada, Reno, FS-06-62
An EEO/AA Institution. Copyright ©
2026, University of Nevada Cooperative Extension.
A partnership of Nevada counties; University of Nevada, Reno; and the U.S. Department of Agriculture
