Introduction
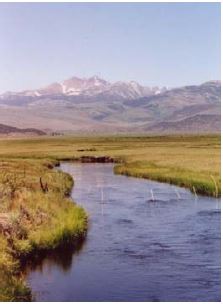
In west-central Nevada lies the Walker River Basin. Fed mainly by the snow melt of the surrounding Sierra Nevada Mountains, the basin provides the vital water that sustains both human and natural livelihoods. Originating in the foothills, the West and East Walker River forks merge approximately eight miles south of Yerington, Nevada to form the larger tributary responsible for supplying Walker Lake in the east central region of the basin. It is here that the river terminates, making Walker one of the few perennial, natural, terminal lakes in the Great Basin.
Because of its unique attributes, the Walker River Basin faces a need for equitable and efficient management. The water that flows through the Walker River Basin is relied upon by communities, agricultural producers, recreational users and natural ecosystems; this multi-use system has created a growing focus on the issues facing the activities that rely on this essential natural resource. At the top of this list are activities that provide for a sustainable community and those that ensure sustainable management of natural resources. In 2003, a survey of water rights owners was conducted to provide a better picture of the issues of which they are most concerned, and to assess their willingness to sell or lease their water rights within the Walker River Basin. The study was conducted using written surveys administered in person to 116 water rights owners in the region. In 2007, a “follow-up” study mailed written surveys to landowners in the Walker River Basin. This more recent study consisted of 70 completed surveys, representing 22 percent of the surveys that were distributed.
In both studies, respondents were asked questions regarding their perceptions of several aspects related to the local community and regional natural resource management activities, in terms of their importance as potential priorities for the basin. This fact sheet will provide readers with an overview of the issues facing the region, as well as a comparison of the 2003 and 2007 survey results.
Survey and Results
Survey respondents were asked to provide some background information. More than half of the respondents, 55 percent, said they had lived in the Walker Basin for 36 or more years. Half of the respondents (50 percent) lived in Mason Valley, 25 percent lived in Smith Valley, 12 percent lived in Antelope Valley, 12 percent lived on the Walker River Indian Reservation, and the remaining three percent lived in Bridgeport. Fifty-seven percent of respondents had been in agriculture for more than 35 years, 78 percent had a less then 500-acre operation, and 58 percent were more than 60 years old.
Respondents in both the 2003 and 2007 studies were presented with a number of potential priorities and asked to indicate how important they felt each was on a scale of one to five, where one indicates the priority is “not important” and five indicates it is “highly important.” All figures in this fact sheet present the relative frequencies (as a percentage of total responses) for each possible response. Respondents completing the 2003 survey were provided the option of a “no answer” response, while this option was not provided on the 2007 survey.
Sustainable Community
Of the eight priorities measured through survey responses, four relate to sustainable communities or community activities in general. These priorities are: benefits from agriculture production, outdoor recreation, economy of area communities and maintaining the customs and culture of the area communities. Following are the results for each of these priorities.
Benefits from Agricultural Production
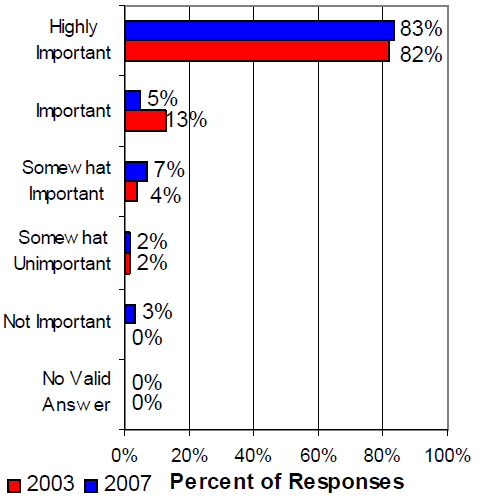
Over all of the priorities dealing with community issues, agricultural production showed the greatest level of importance in both 2003 and 2007 (Figure 1). Between the two years, the frequency of respondents indicating that agriculture was “highly important” remained relatively stable, with 82 percent of all responses in 2003 and 83 percent in 2007. Additionally, 13 percent and five percent of respondents indicated that agriculture was “important” in 2003 and 2007, respectively. Only 12 percent of respondents to the 2007 study and six percent of respondents to the 2003 study rated agriculture as somewhat important, somewhat unimportant or not important.
Outdoor Recreation
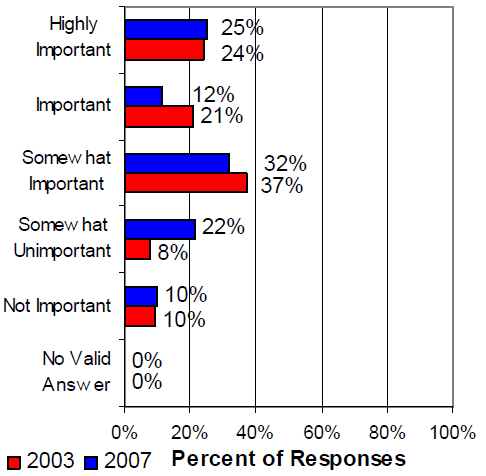
When survey respondents were asked to rate their perceptions of the importance of outdoor recreation, the most frequently-given responses indicated that they felt it was “somewhat important” (Figure 2). Such a response accounted for 37 percent of the surveys completed in 2003, with a drop to 32 percent in 2007. Respondents indicating that outdoor recreation was “important” also dropped between the two studies, from 21 percent in 2003 to 12 percent in 2007. In contrast, the frequency of “somewhat unimportant” increased from eight percent in 2003 to 22 percent in 2007. Overall, the total frequency of responses indicating that outdoor recreation had some level of importance decreased from 45 percent in 2003 to 37 percent in 2007, a total of eight percentage points, while those indicating that it was unimportant increased from 18 percent in 2003 to 32 percent in 2007, a total of 14 percentage points.
Figure 1: Importance of Benefits from Agricultural Production
Data From Figure 1
Figure 2: Importance of Outdoor Recreation
Data From Figure 2
Importance of Area Economy
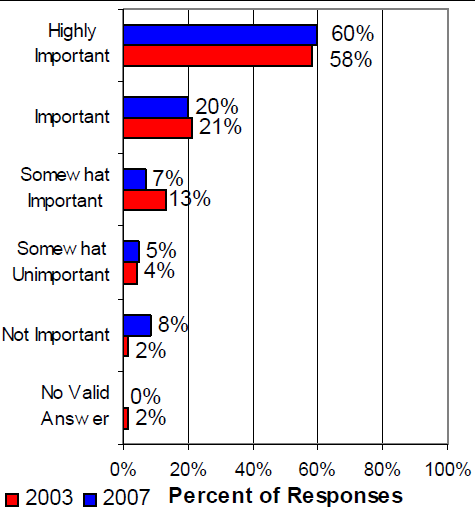
Figure 3 shows a comparison of perceptions regarding the importance of the area economy. For this priority, the relative frequency of each possible response remained reasonably consistent between the 2003 and 2007 results. However, the percent of “somewhat important” responses decreased during the second study, dropping from 13 percent in 2003 to seven percent in 2007. In contrast, the frequency of those indicating that the area was “not important” to them increased by a total of six percentage points between the two studies.
Figure 3: Importance of Area Economy
Data From Figure 3
Importance of Maintaining Local Customs and Culture
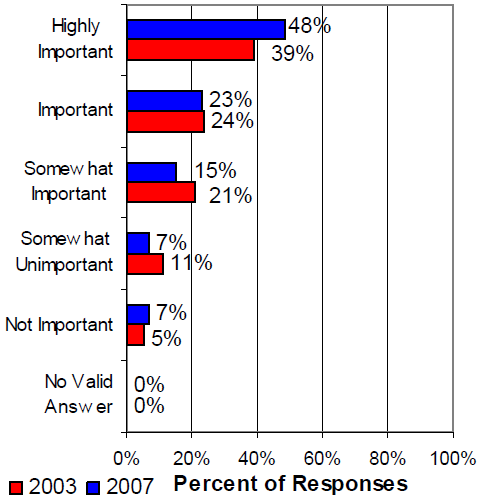
The final priority pertaining to sustainable communities that respondents were asked to consider related to the preservation and maintenance of regional culture and customs (Figure 4). In 2007, 48 percent of all responses provided indicated that the attribute was “highly important” to the individuals completing the surveys, a rise from 38 percent in 2003. In relation to this comparison, the frequency of “somewhat important” and “somewhat unimportant” responses experienced overall decreases of six and four percentage points, respectively.
Management of Natural Resources
The second category of priorities for which importance measurements were taken relates to management practices and techniques for sustainable natural resources. These four priorities include: the availability of open space, the presence of fisheries, the quality of the water in the Walker River, and the maintenance of riparian zones, or the “ecosystems that occur along watercourses or water bodies” (Natural Resources Conservation Service, 2008).
Figure 4: Importance of Maintaining Area Customs/Cultures
Data From Figure 4
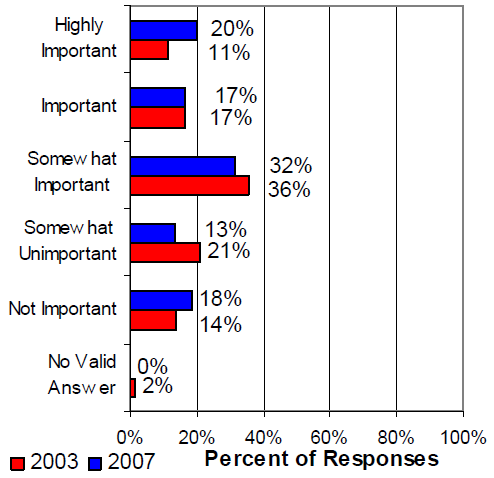
Figure 5: Importance of Open Space
Data From Figure 5
Importance of Open Space
Between the 2003 and 2007 studies, a shift in the perception of open space occurred within the results, with an overall increase of 31 percentage points in the frequency of respondents indicating that open space held some level of importance (Figure 5). Respondents giving open space the “highly important” rating showed the largest increase in frequency (a change of 14 percentage points), while the largest decrease was experienced in the frequency of “somewhat important” responses (13 percentage points).
Importance of Fisheries
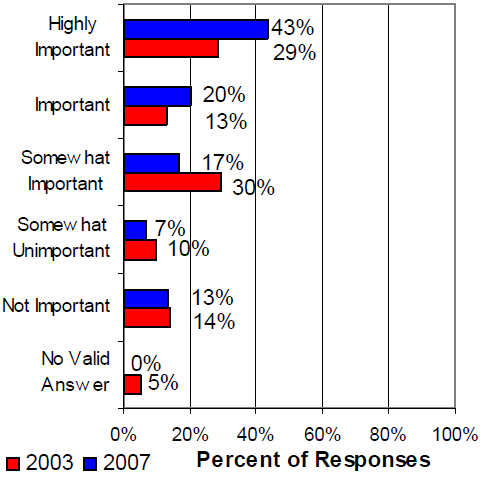
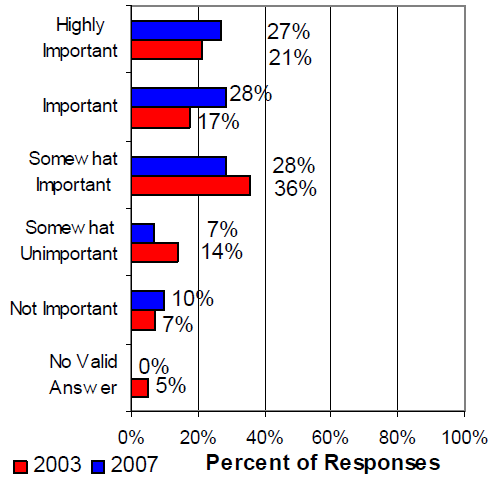
Respondents were asked to rate their perception of the importance of fisheries in the region (Figure 6). It is important to note that in the 2003 survey, respondents were asked to provide their perceptions of two different fisheries (one for Lahontan cutthroat trout, the other for brown and rainbow trout), while the 2007 survey asked respondents to address fisheries in general. For the purposes of comparison, the average of all responses for the two fisheries on the 2003 survey was used to generate a standardized rating for fisheries in general.
The question relating to respondent’s perceptions of fisheries within the Walker River Basin presents perhaps the most even distribution of responses across both survey years. The frequency of responses indicating that fisheries were “highly important” increased by a total of nine percentage points between 2003 and 2007 (Figure 6). For the 2007 results, 37 percent of responses indicated that the priority was perceived as “highly important” or “important,” 32 percent felt it was “somewhat important,” and 31 percent indicated it was “somewhat unimportant” or “not important.” The results for the 2003 survey were similar, with 29 percent “highly important” or “important,” 36 percent “somewhat important,” and 35 percent “somewhat unimportant” or “not important.”
Figure 6: Importance of Fisheries
Data From Figure 6
Importance of Walker River Water Quality
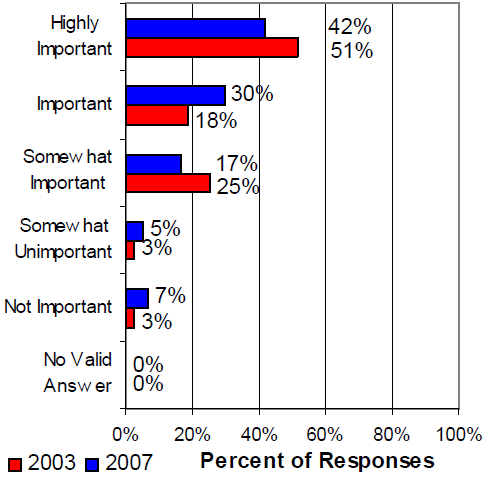
When asked to rate the importance of water quality of the Walker River, 72 percent of respondents in 2007 indicated that the priority was “highly important” or “important” while 69 percent responded this way in 2003 (Figure 7). The largest change was seen with those indicating that water quality was “important” (as opposed to “highly important” or “somewhat important”), increasing by 12 percentage points between 2003 and 2007. The number indicating that water quality had little importance to them was relatively small, with only six percent in 2003 and 12 percent in 2007.
Figure 7: Importance of Walker River Water Quality
Data From Figure 7
Importance of Riparian Areas
The final priority which survey respondents were asked to consider focused on their perception of riparian areas in general (Figure 8). Between the two survey years, the frequency of respondents indicating that these areas held some level of importance to them increased 17 percentage points, while those indicating that the areas were relatively unimportant to them decreased by four percentage points. The largest change for a single response frequency was that of “important,” which increased by 11 percentage points. In 2003, the most frequent result was that respondents felt riparian zones were “somewhat important,” but in 2007 this response was equal to those respondents who indicated that the areas were “important” and only one point greater than those indicating that they were “highly important.”
Figure 8: Importance of Riparian Areas
Data From Figure 8
Conclusions
The two studies provide a glimpse at the changing perceptions in the Walker River Basin regarding the importance of issues that affect both the local community and the regional environment. For both years, benefits from agriculture and the area economy were seen as the two most important community issues. Between the studies, the perception of local culture and customs grew more important, while those regarding outdoor recreation opportunities saw little change. In contrast to community issues, which changed with relative uniformity amongst all four priorities, issues concerning natural resources experienced a wider range of changes. The importance of open space in 2007 increased by two thirds of the original results in 2003 and perceptions about water quality moved from “highly important” to “important.” Riparian areas also showed higher importance levels to survey respondents in 2007, while fisheries perceptions varied greatly.
References
Emm, S., D. Breazeale, and M. Smith. 2007. “Walker River Basin Research Study: Environmental Priorities.” University of Nevada Cooperative Extension Fact Sheet FS-07-02.
United States Geological Survey Nevada Water Science Center. 2008. “Hydrology of the Walker River Basin.” Online. Available at Hydrology of the Walker River Basin. Accessed April 2008.
United States Department of Agriculture Natural Resources Conservation Service. 2008. “Overview of Riparian Areas.” Online. Available at Overview of Riparian Areas. Accessed April 2008.
Nevada Division of Water Resources. 2008. “Water Words Dictionary.” Online. Available at: Water Words Dictionary. Accessed May 2008.
